31 Clustering
31.1 DBSCAN
31.2 k-Means Clustering
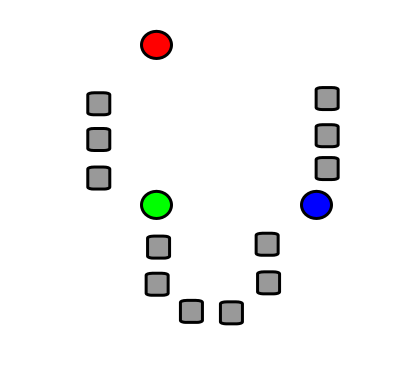
The \(k\)-means algorithm is an unsupervised learning algorithm that has a loose relationship to the \(k\)-nearest neighbor classifier. The \(k\)-means algorithm works as follows:
- Step 1: Randomly choose \(k\) centers. Assign points to cluster.
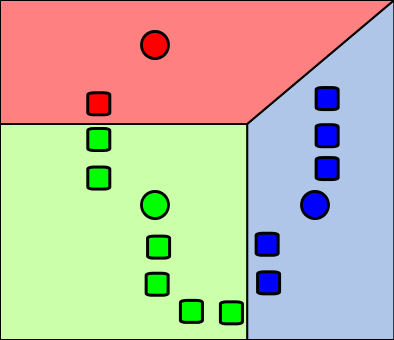
- Step 2: Determine the distances of each data point to the centroids and re-assign each point to the closest cluster centroid based upon minimum distance
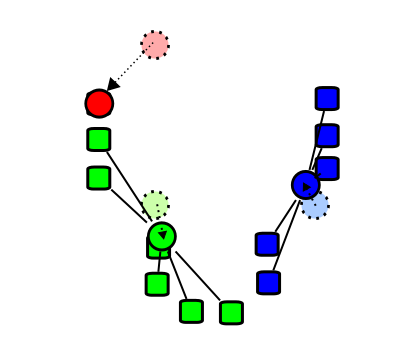
- Step 3: Calculate cluster centroids again
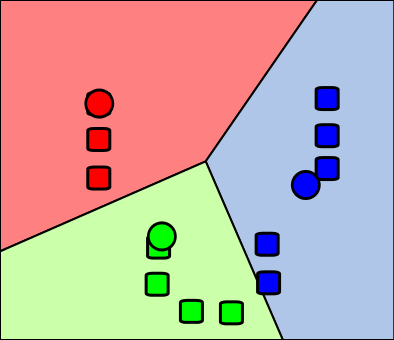
- Step 4: Repeat steps 2 and 3 until we reach global optima where no improvements are possible and no switching of data points from one cluster to other.
The basic principle of the \(k\)-means algorithm is illustrated in Figure 31.1, Figure 31.2, Figure 31.3, and Figure 31.4.
- Video: K-means clustering
31.3 DDMO-Additional Videos
- Odds and Log(Odds), Clearly Explained!!!
- One-Hot, Label, Target and K-Fold Target Encoding, Clearly Explained!!!
- Maximum Likelihood for the Exponential Distribution, Clearly Explained!!!
- ROC and AUC, Clearly Explained!
- Entropy (for data science) Clearly Explained!!!
- Classification Trees in Python from Start to Finish: Long live video!
31.4 DDMO-Exercises
Exercise 31.1 (Smaller Bins) What happens when we use smaller bins in a histogram?
Exercise 31.2 (Density Curve) Why plot a curve to approximate a histogram?
Exercise 31.3 (TwoSDQuestion) How many samples are plus/minus two SD around the mean?
Exercise 31.4 (OneSDQuestion) How many samples are plus/minus one SD around the mean?
Exercise 31.5 (ThreeSDQuestion) How many samples are plus/minus three SD around the mean?
Exercise 31.6 (DataRangeQuestion) You have a mean at 100 and a SD of 10. Where are 95% of the data?
Exercise 31.7 (PeakHeightQuestion) If the peak is very high, is the SD low or high?
Exercise 31.8 (ProbabilityQuestion) If we have a certain curve and want to calculate the probability of values equal to 20 if the mean is 20.
Exercise 31.9 (MeanDifferenceQuestion) The difference between \(\mu\) and x-bar?
Exercise 31.10 (EstimateMeanQuestion) How do you calculate the sample mean?
Exercise 31.11 (SigmaSquaredQuestion) What is sigma squared?
Exercise 31.12 (EstimatedSDQuestion) What is the formula for the estimated standard deviation?
Exercise 31.13 (VarianceDifferenceQuestion) Difference between the variance and the estimated variance?
Exercise 31.14 (ModelBenefitsQuestion) What are the benefits of using models?
Exercise 31.15 (SampleDefinitionQuestion) What is a sample in statistics?
Exercise 31.16 (RejectHypothesisQuestion) What does it mean to reject a hypothesis?
Exercise 31.17 (NullHypothesisQuestion) What is a null hypothesis?
Exercise 31.18 (BetterDrugQuestion) How can you show that you have found a better drug?
Exercise 31.19 (PValueIntroductionQuestion) What is the reason for introducing the p-value?
Exercise 31.20 (PValueRangeQuestion) Is there any range for p-values? Can it be negative?
Exercise 31.21 (PValueRangeQuestion) Is there any range for p-values? Can it be negative?
Exercise 31.22 (TypicalPValueQuestion) What are typical values of the p-value and what does it mean? 5%?
Exercise 31.23 (FalsePositiveQuestion) What is a false-positive?
Exercise 31.24 (CalculatePValueQuestion) How to calculate p-value?
Exercise 31.25 (SDCalculationQuestion) What is the SD if the mean is 155 and in the range from 142 - 169 there are 95% of the data?
Exercise 31.26 (SidedPValueQuestion) When do we need the two-sided p-value and when the one-sided?
Exercise 31.27 (CoinTestQuestion) Test a coin with Tail-Head-Head. What is the p-value?
Exercise 31.28 (BorderPValueQuestion) If you get exactly the 0.05 border value, can you reject?
Exercise 31.29 (OneSidedPValueCautionQuestion) Why should you be careful with a one-sided p-test?
Exercise 31.30 (BinomialDistributionQuestion) What is the binomial distribution?
Exercise 31.31 (PHackingWaysQuestion) Name two typical ways of p-hacking.
Exercise 31.32 (AvoidPHackingQuestion) How can p-hacking be avoided?
Exercise 31.33 (MultipleTestingProblemQuestion) What is the multiple testing problem?
31.4.0.1 Covariance
Exercise 31.34 (CovarianceDefinitionQuestion) What is covariance?
Exercise 31.35 (CovarianceMeaningQuestion) What is the meaning of covariance?
Exercise 31.36 (CovarianceVarianceRelationshipQuestion) What is the relationship between covariance and variance?
Exercise 31.37 (HighCovarianceQuestion) If covariance is high, is there a strong relationship?
Exercise 31.38 (ZeroCovarianceQuestion) What if the covariance is zero?
Exercise 31.39 (NegativeCovarianceQuestion) Can covariance be negative?
Exercise 31.40 (NegativeVarianceQuestion) Can variance be negative?
Exercise 31.41 (CorrelationValueQuestion) What do you do if the correlation value is 10?
Exercise 31.42 (CorrelationRangeQuestion) What is the possible range of correlation values?
Exercise 31.43 (CorrelationFormulaQuestion) What is the formula for correlation?
Exercise 31.44 (UnderstandingStatisticalPower) What is the definition of power in a statistical test?
Exercise 31.45 (DistributionEffectOnPower) What is the implication for power analysis if the samples come from the same distribution?
Exercise 31.46 (IncreasingPower) How can you increase the power if the distributions are very similar?
Exercise 31.47 (PreventingPHacking) What should be done to avoid p-hacking when the distributions are close to each other?
Exercise 31.48 (SampleSizeAndPower) If there is overlap and the sample size is small, will the power be high or low?
Exercise 31.49 (FactorsAffectingPower) Which are the two main factors that affect power?
Exercise 31.50 (PurposeOfPowerAnalysis) What does power analysis tell us?
Exercise 31.51 (ExperimentRisks) What are the two risks faced when performing an experiment?
Exercise 31.52 (PerformingPowerAnalysis) How do you perform a power analysis?
Exercise 31.53 (CentralLimitTheoremExplanation) What does the Central Limit Theorem state?
Exercise 31.54 (MedianInBoxplot) What is represented by the middle line in a boxplot?
Exercise 31.55 (BoxContentInBoxplot) What does the box in a boxplot represent?
Exercise 31.56 (RSquaredDefinition) What is R-squared? Show the formula.
Exercise 31.57 (NegativeRSquared) Can the R-squared value be negative?
Exercise 31.58 (RSquaredCalculation) Perform a calculation involving R-squared.
Exercise 31.59 (LeastSquaresMeaning) What is the meaning of the least squares method?
Exercise 31.60 (RegressionVsClassification) What is the difference between regression and classification?
Exercise 31.61 (LikelihoodConcept) What is the idea of likelihood?
Exercise 31.62 (ProbabilityVsLikelihood) What is the difference between probability and likelihood?
Exercise 31.63 (TrainVsTestData) What is the difference between training and testing data?
Exercise 31.64 (SingleValidationIssue) What is the problem if you validate the model only once?
Exercise 31.65 (FoldDefinition) What is a fold in cross-validation?
Exercise 31.66 (LeaveOneOutValidation) What is leave-one-out cross-validation?
Exercise 31.67 (DrawingConfusionMatrix) Draw the confusion matrix.
Exercise 31.68 (SensitivitySpecificityCalculation1) Calculate the sensitivity and specificity for a given confusion matrix.
Exercise 31.69 (SensitivitySpecificityCalculation2) Calculate the sensitivity and specificity for a given confusion matrix.
Exercise 31.70 (BiasAndVariance) What are bias and variance?
Exercise 31.71 (MutualInformationExample) Provide an example and calculate if mutual information is high or low.
Exercise 31.72 (WhatIsPCA) What is PCA?
Exercise 31.73 (ScreePlotExplanation) What is a scree plot?
Exercise 31.74 (LeastSquaresInPCA) Does PCA use least squares?
Exercise 31.75 (PCASteps) Which steps are performed by PCA?
Exercise 31.76 (EigenvaluePC1) What is the eigenvalue of the first principal component?
Exercise 31.77 (DifferencesBetweenPoints) Are the differences between red and yellow the same as the differences between red and blue points?
Exercise 31.78 (ScalingInPCA) How to scale data in PCA?
Exercise 31.79 (DetermineNumberOfComponents) How to determine the number of principal components?
Exercise 31.80 (LimitingNumberOfComponents) How is the number of principal components limited?
Exercise 31.81 (WhyUseTSNE) Why use t-SNE?
Exercise 31.82 (MainIdeaOfTSNE) What is the main idea of t-SNE?
Exercise 31.83 (BasicConceptOfTSNE) What is the basic concept of t-SNE?
Exercise 31.84 (TSNESteps) What are the steps in t-SNE?
Exercise 31.85 (HowKMeansWorks) How does K-means clustering work?
Exercise 31.86 (QualityOfClusters) How can the quality of the resulting clusters be calculated?
Exercise 31.87 (IncreasingK) Why is it not a good idea to increase k too much?
Exercise 31.88 (CorePointInDBSCAN) What is a core point in DBSCAN?
Exercise 31.89 (AddingVsExtending) What is the difference between adding and extending in DBSCAN?
Exercise 31.90 (OutliersInDBSCAN) What are outliers in DBSCAN?
Exercise 31.91 (AdvantagesAndDisadvantagesOfK) What are the advantages and disadvantages of k = 1 and k = 100 in K-nearest neighbors?
Exercise 31.92 (NaiveBayesFormula) What is the formula for Naive Bayes?
Exercise 31.93 (CalculateProbabilities) Calculate the probabilities for a given example using Naive Bayes.
Exercise 31.94 (UnderflowProblem) Why is underflow a problem in Gaussian Naive Bayes?
Exercise 31.95 (Tree Usage) For what can we use trees?
Exercise 31.96 (Tree Usage) Based on a shown tree graph:
- How can you use this tree?
- What is the root node?
- What are branches and internal nodes?
- What are the leafs?
- Are the leafs pure or impure?
- Which of the leafs is more impure?
Exercise 31.97 (Tree Feature Importance) Is the most or least important feature on top?
Exercise 31.98 (Tree Feature Imputation) How can you fill a gap/missing data?
Solution 31.1 (Tree Feature Imputation).
- Mean
- Median
- Comparing to column with high correlation
Exercise 31.99 (Regression Tree Limitations) What are limitations?
Exercise 31.100 (Regression Tree Score) How is the tree score calculated?
Exercise 31.101 (Regression Tree Alpha Value Small) What can we say about the tree if the alpha value is small?
Exercise 31.102 (Regression Tree Increase Alpha Value) What happens if you increase alpha?
Exercise 31.103 (Regression Tree Pruning) What is the meaning of pruning?