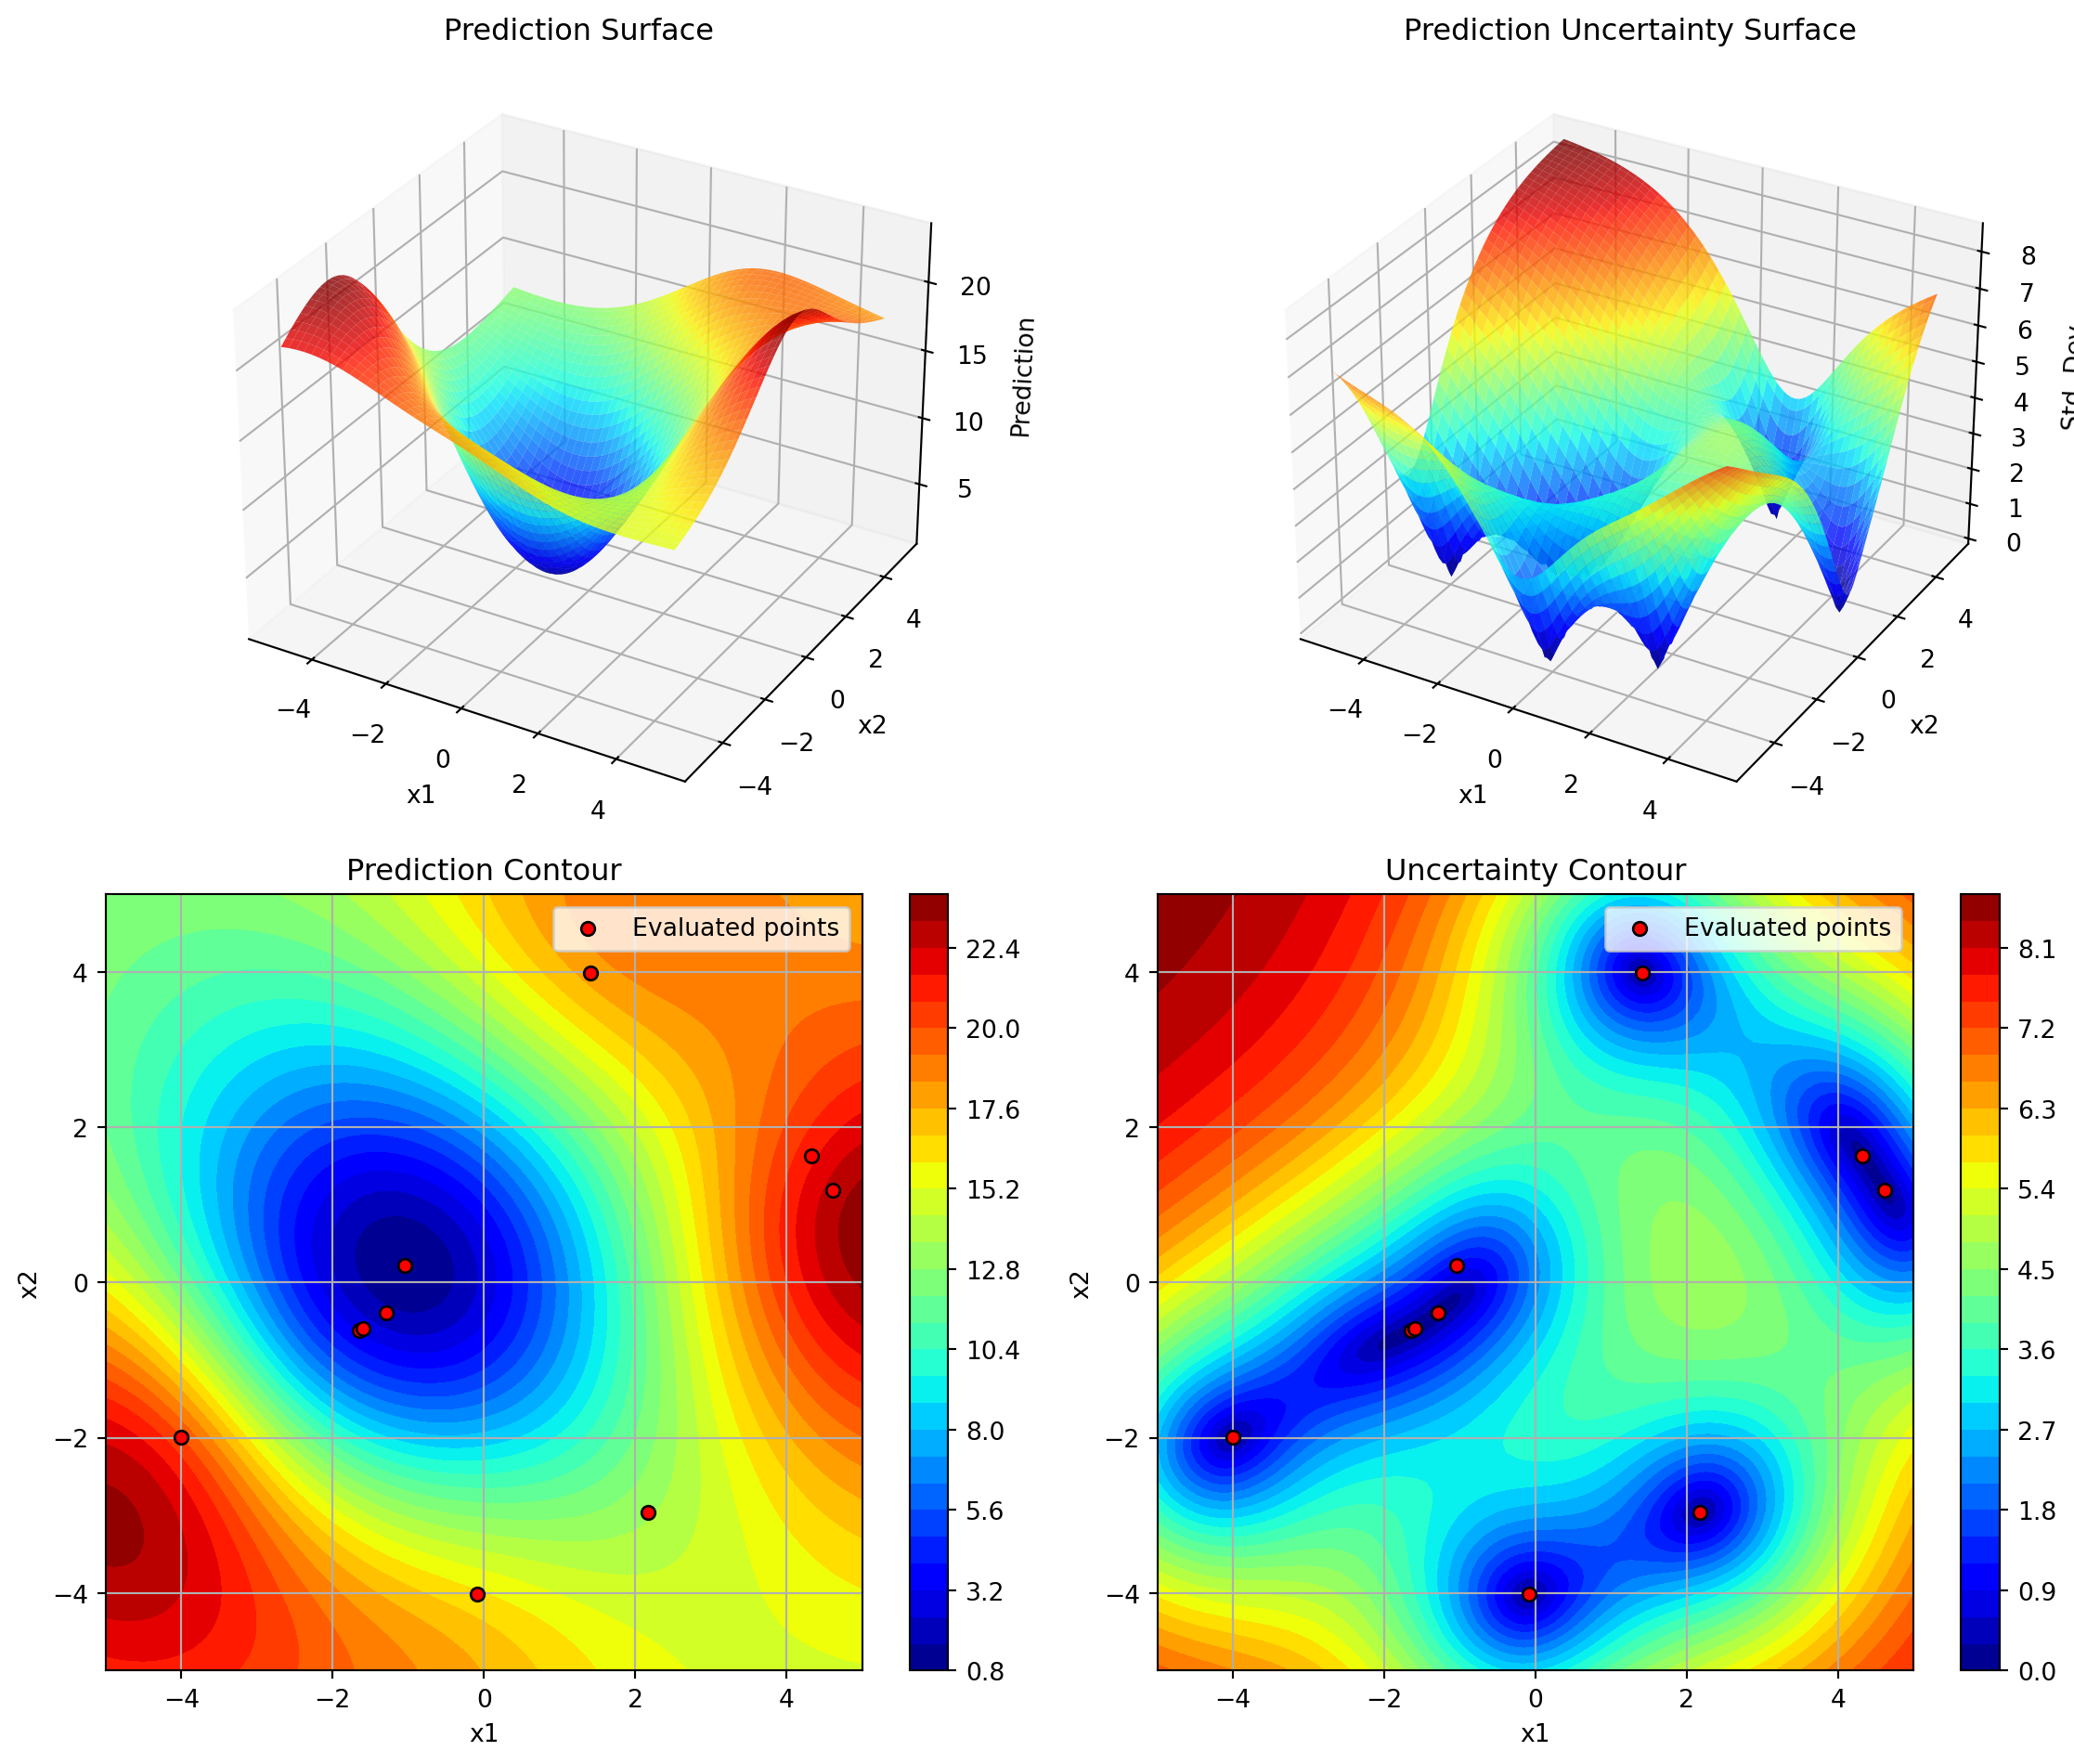
= 0 ,= 1 ,= True ,= 0.8 ,= None ,= 'jet' ,= 100 ,= None ,= None ,= True ,= True ,= 30 ,= (12 , 10 ),Plot the surrogate model for two dimensions.
Creates a 2x2 plot showing: - Top left: 3D surface of predictions - Top right: 3D surface of prediction uncertainty - Bottom left: Contour plot of predictions with evaluated points - Bottom right: Contour plot of prediction uncertainty
Parameters
optimizer
SpotOptimProtocolSpotOptim instance containing optimization data and surrogate model.
required
i
int Index of the first dimension to plot. Defaults to 0.
0
j
int Index of the second dimension to plot. Defaults to 1.
1
show
bool If True, displays the plot immediately. Defaults to True.
True
alpha
float Transparency of the 3D surface plots (0=transparent, 1=opaque). Defaults to 0.8.
0.8
var_name
list of str
Names for each dimension. If None, uses instance var_name. Defaults to None.
None
cmap
str Matplotlib colormap name. Defaults to ‘jet’.
'jet'
num
int Number of grid points per dimension for mesh grid. Defaults to 100.
100
vmin
float Minimum value for color scale. If None, determined from data. Defaults to None.
None
vmax
float Maximum value for color scale. If None, determined from data. Defaults to None.
None
add_points
bool If True, overlay evaluated points on contour plots. Defaults to True.
True
grid_visible
bool If True, show grid lines on contour plots. Defaults to True.
True
contour_levels
int Number of contour levels. Defaults to 30.
30
figsize
tuple of int
Figure size in inches (width, height). Defaults to (12, 10).
(12, 10)
Raises
ValueError If optimization hasn’t been run yet, or if i, j are invalid.
ImportError If matplotlib is not installed.
Examples
import numpy as npfrom spotoptim import SpotOptimfrom spotoptim.plot.visualization import plot_surrogatefrom spotoptim.function import sphere= SpotOptim(fun= sphere,= [(- 5 , 5 ), (- 5 , 5 )],= 10 ,= 5 ,= ['x1' , 'x2' ])= opt.optimize()# Plot surrogate model for dimensions 0 and 1 = 0 , j= 1 , show= False )