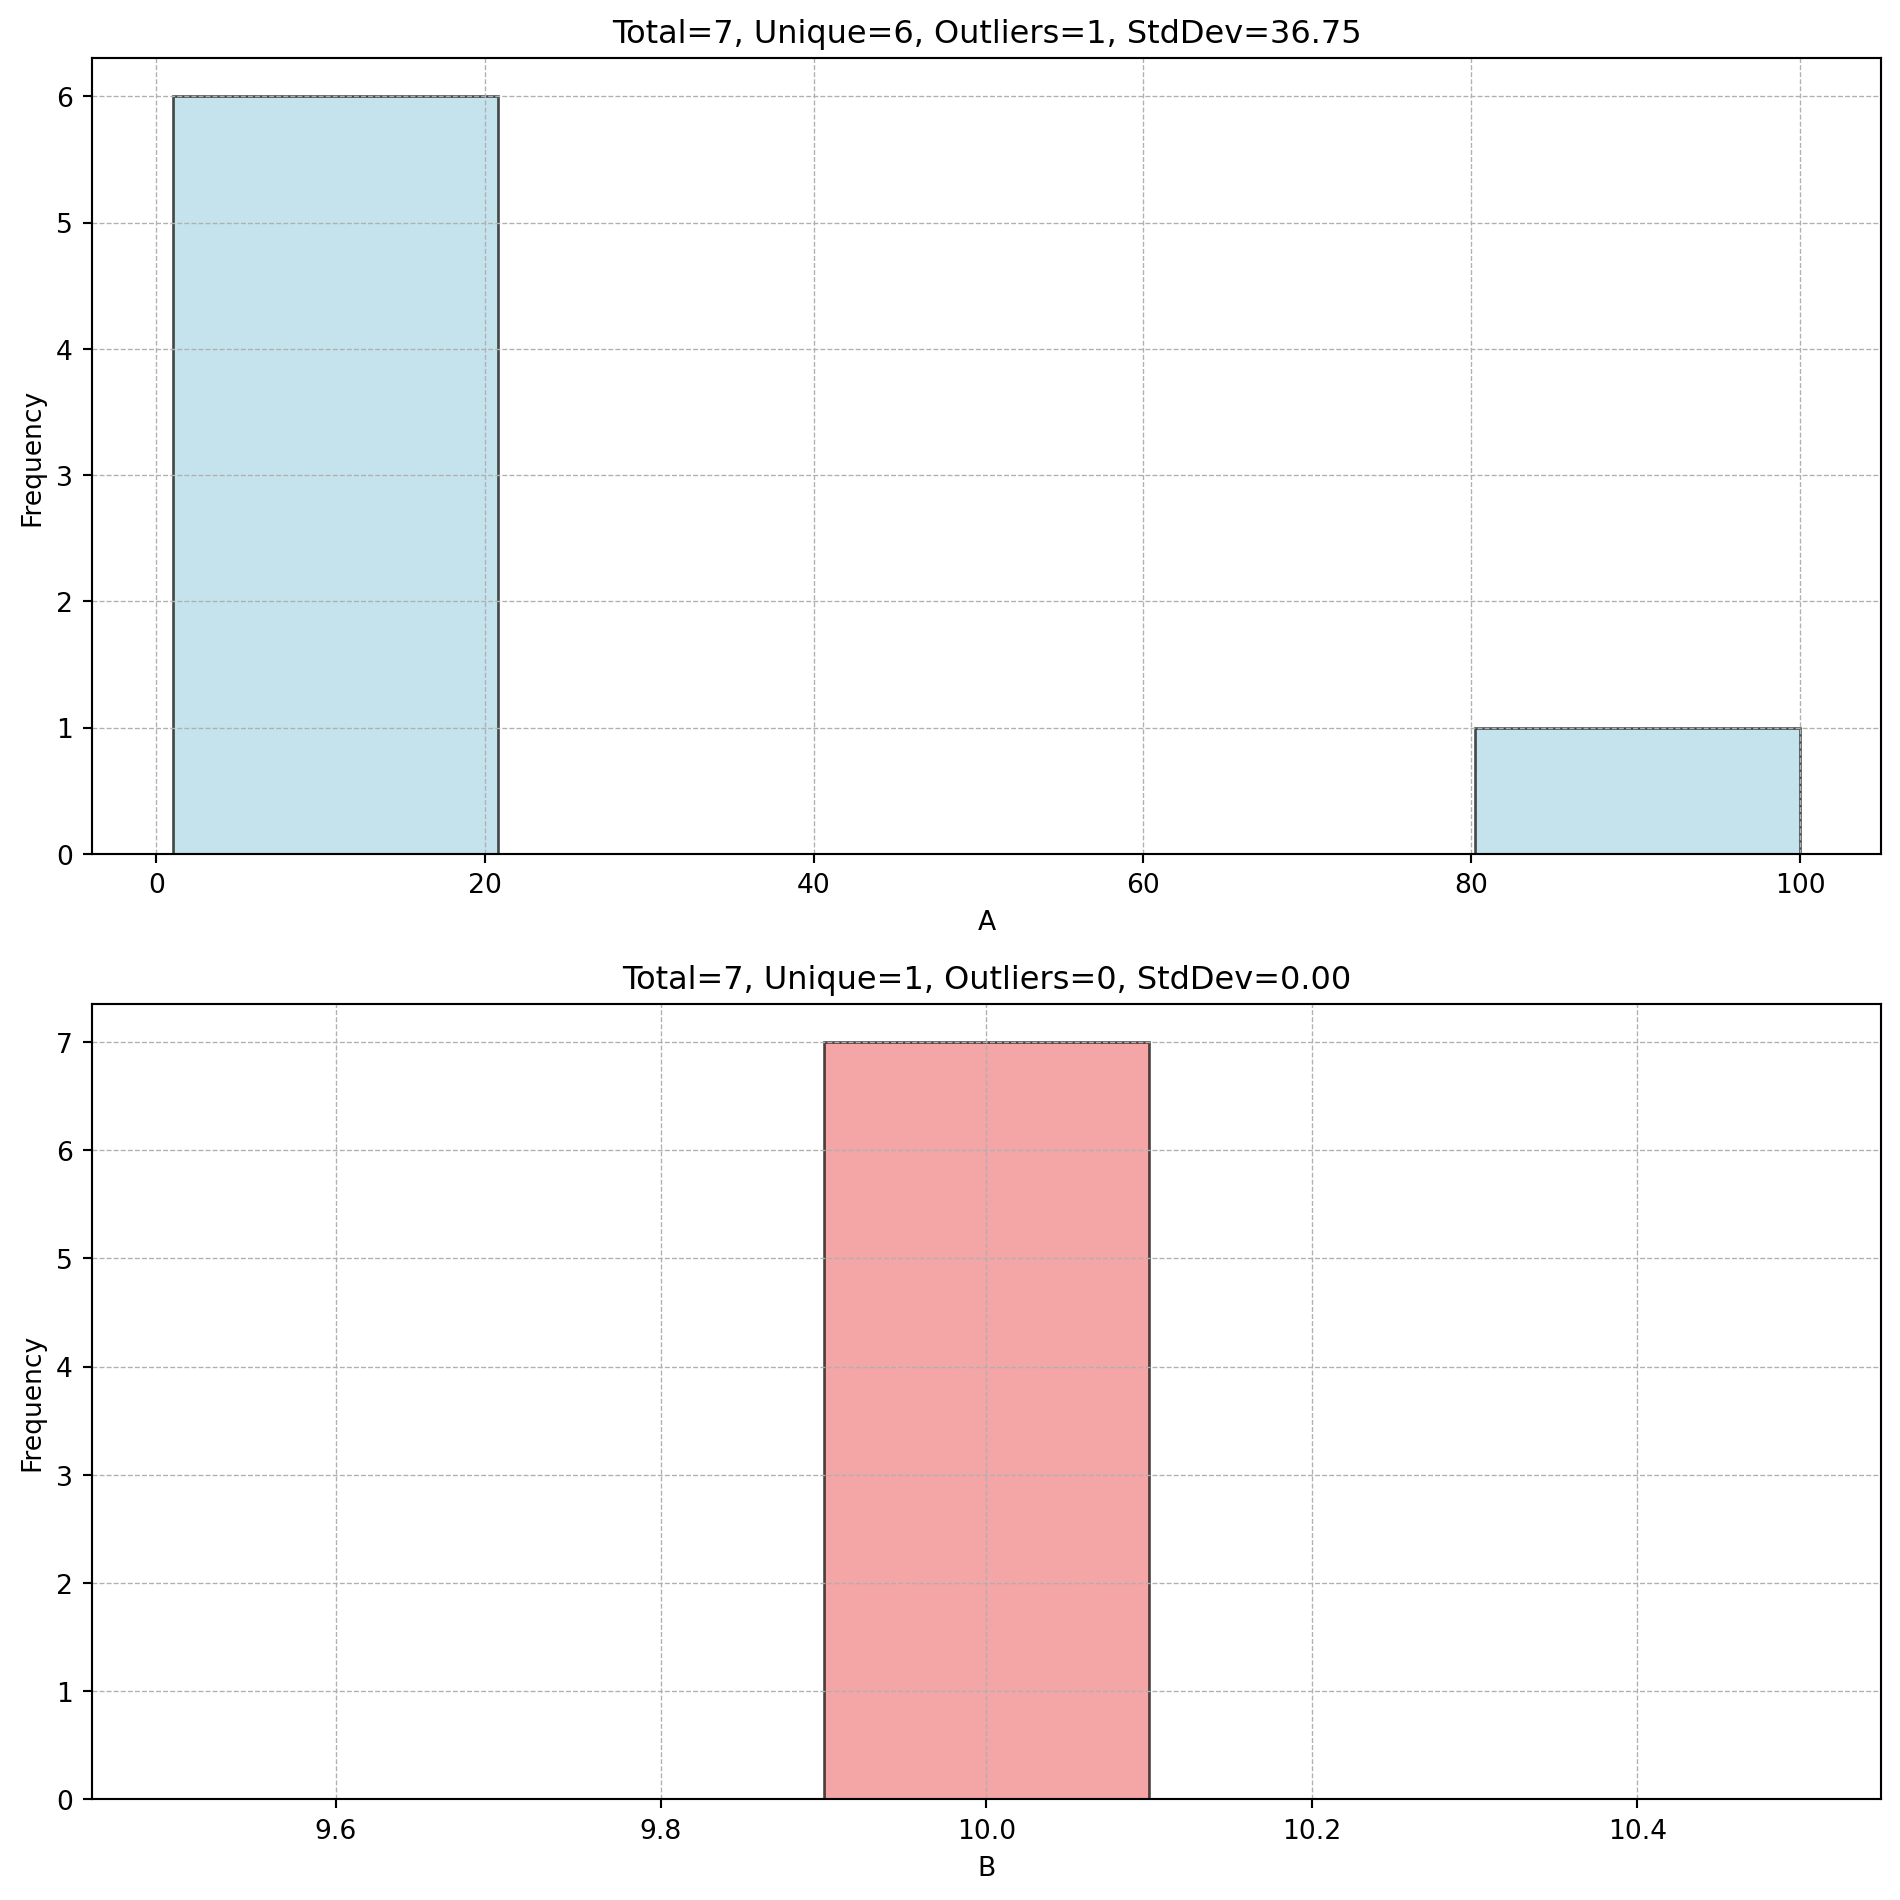
Generate infill-point histograms for each numerical column in a DataFrame.
A separate histogram is created for each numerical column of df and arranged in a grid. The title of each subplot shows the total point count, the number of unique values, the number of outliers detected via the IQR method, and the standard deviation. Columns with fewer unique values than thrs_unique are coloured differently to draw attention to low-variability features.
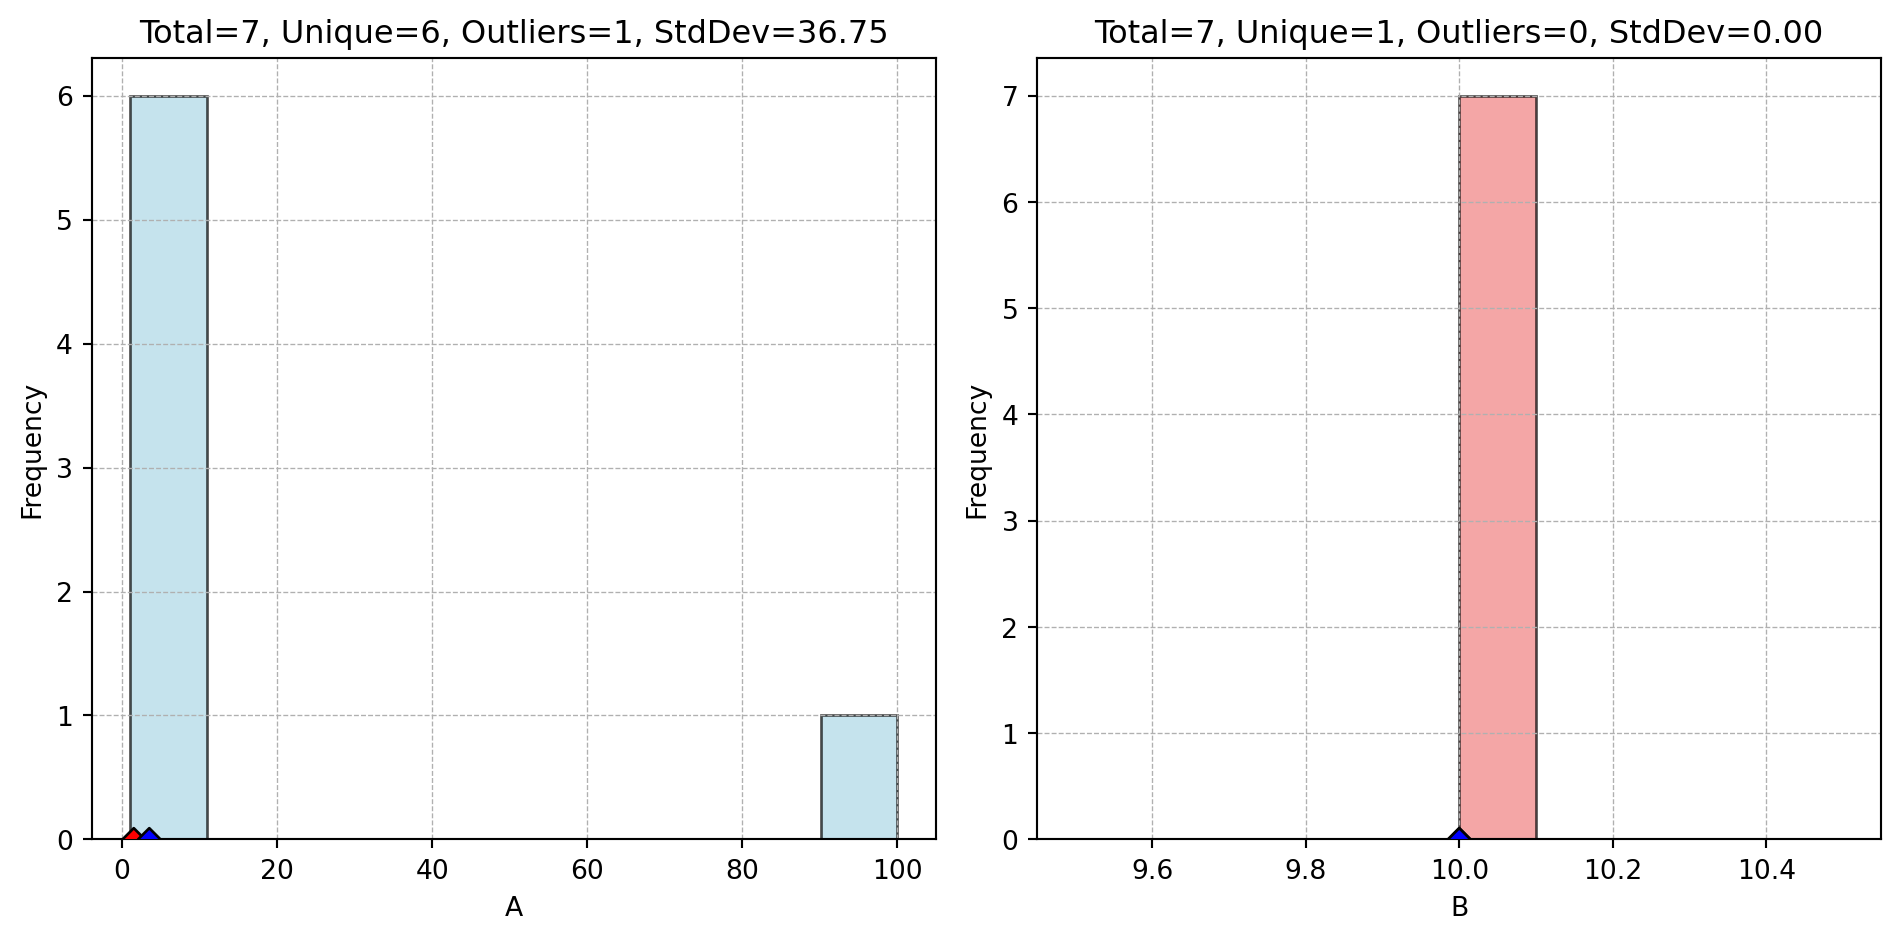
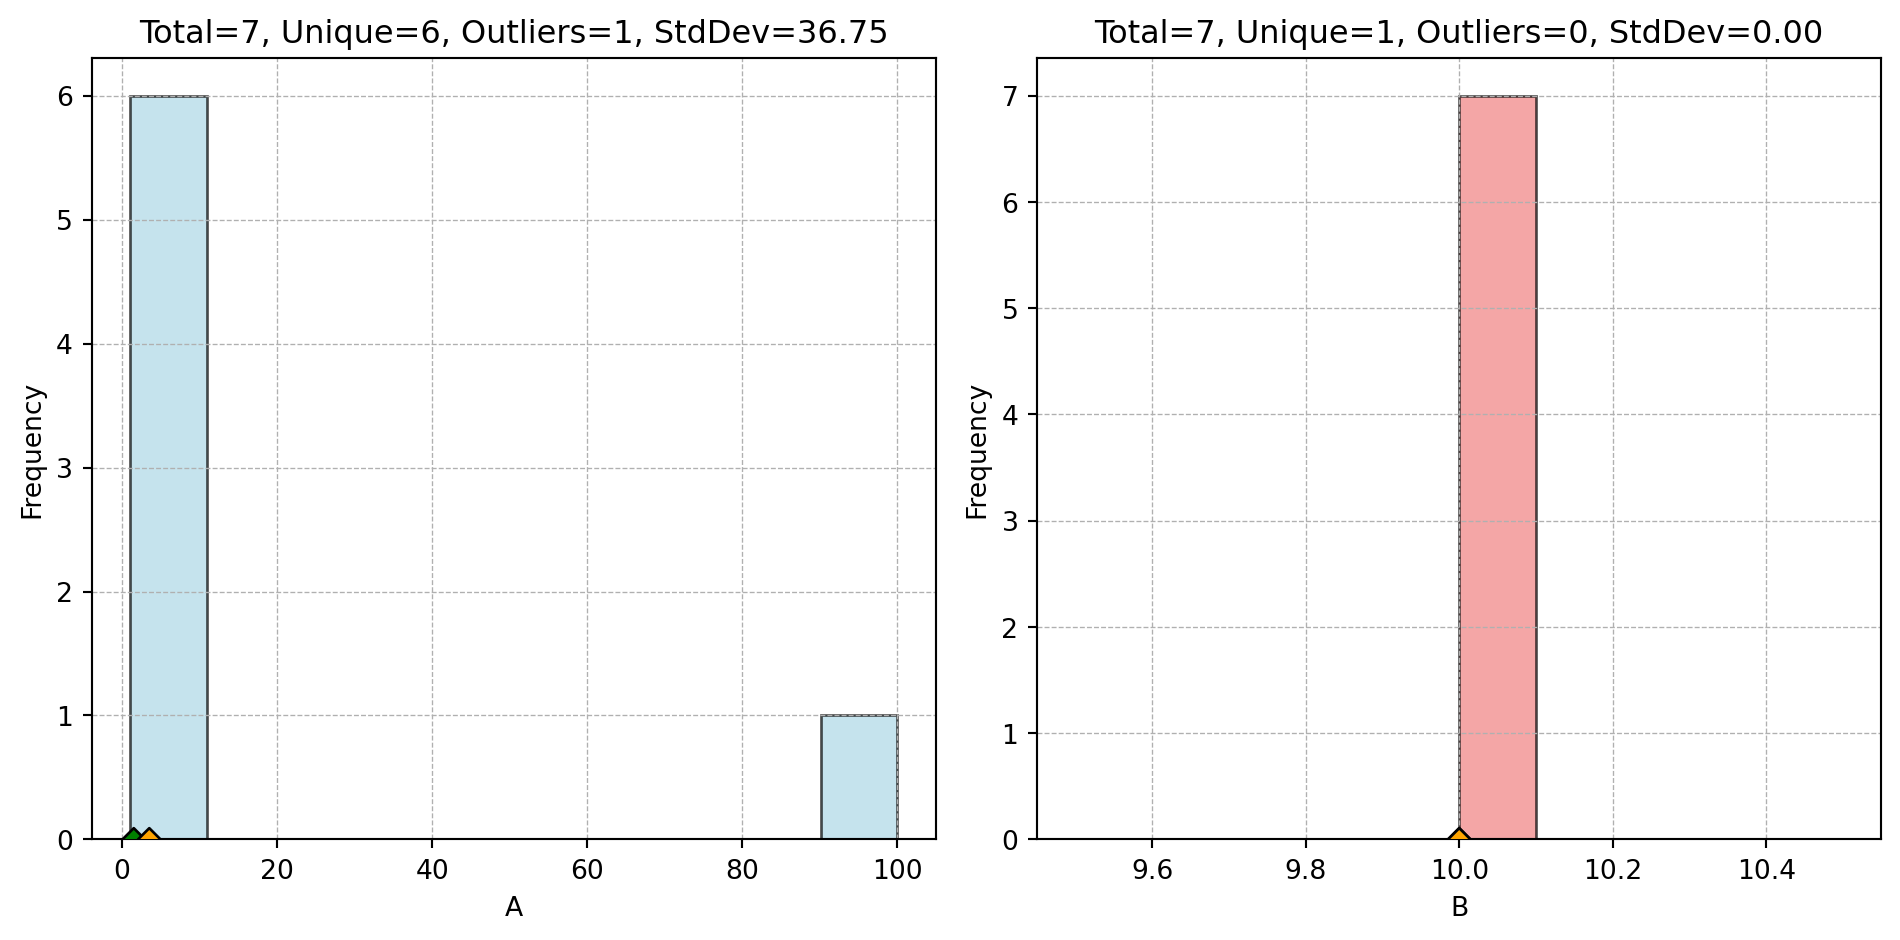
If add_points is provided and its numerical columns differ from those of df in name but agree in count, the column names of add_points are silently replaced by those of df before plotting. This ensures that infill points drawn from a differently named search space are always overlaid correctly.
If the number of rows in add_points does not equal the length of add_points_col.
Examples
import pandas as pdfrom spotoptim.eda.plots import plot_ip_histogramsdata = {'A': [1, 2, 2, 3, 4, 5, 100], 'B': [10, 10, 10, 10, 10, 10, 10]}df = pd.DataFrame(data)plot_ip_histograms(df, bins=5, num_cols=1, thrs_unique=3)# Example with multiple added points and colorsadd_points = pd.DataFrame({'A': [1.5, 3.5], 'B': [10, 10]})plot_ip_histograms(df, add_points=add_points, add_points_col=["red", "blue"])# Example: add_points with different column names are aligned automaticallyadd_points_renamed = pd.DataFrame({'x': [1.5, 3.5], 'y': [10, 10]})plot_ip_histograms(df, add_points=add_points_renamed, add_points_col=["green", "orange"])
References
Bartz-Beielstein, T. (2025). Multi-Objective Optimization and Hyperparameter Tuning With Desirability Functions. arXiv preprint arXiv:2503.23595. https://arxiv.org/abs/2503.23595