import pandas as pd
from spotoptim.eda.plots import plot_ip_histograms
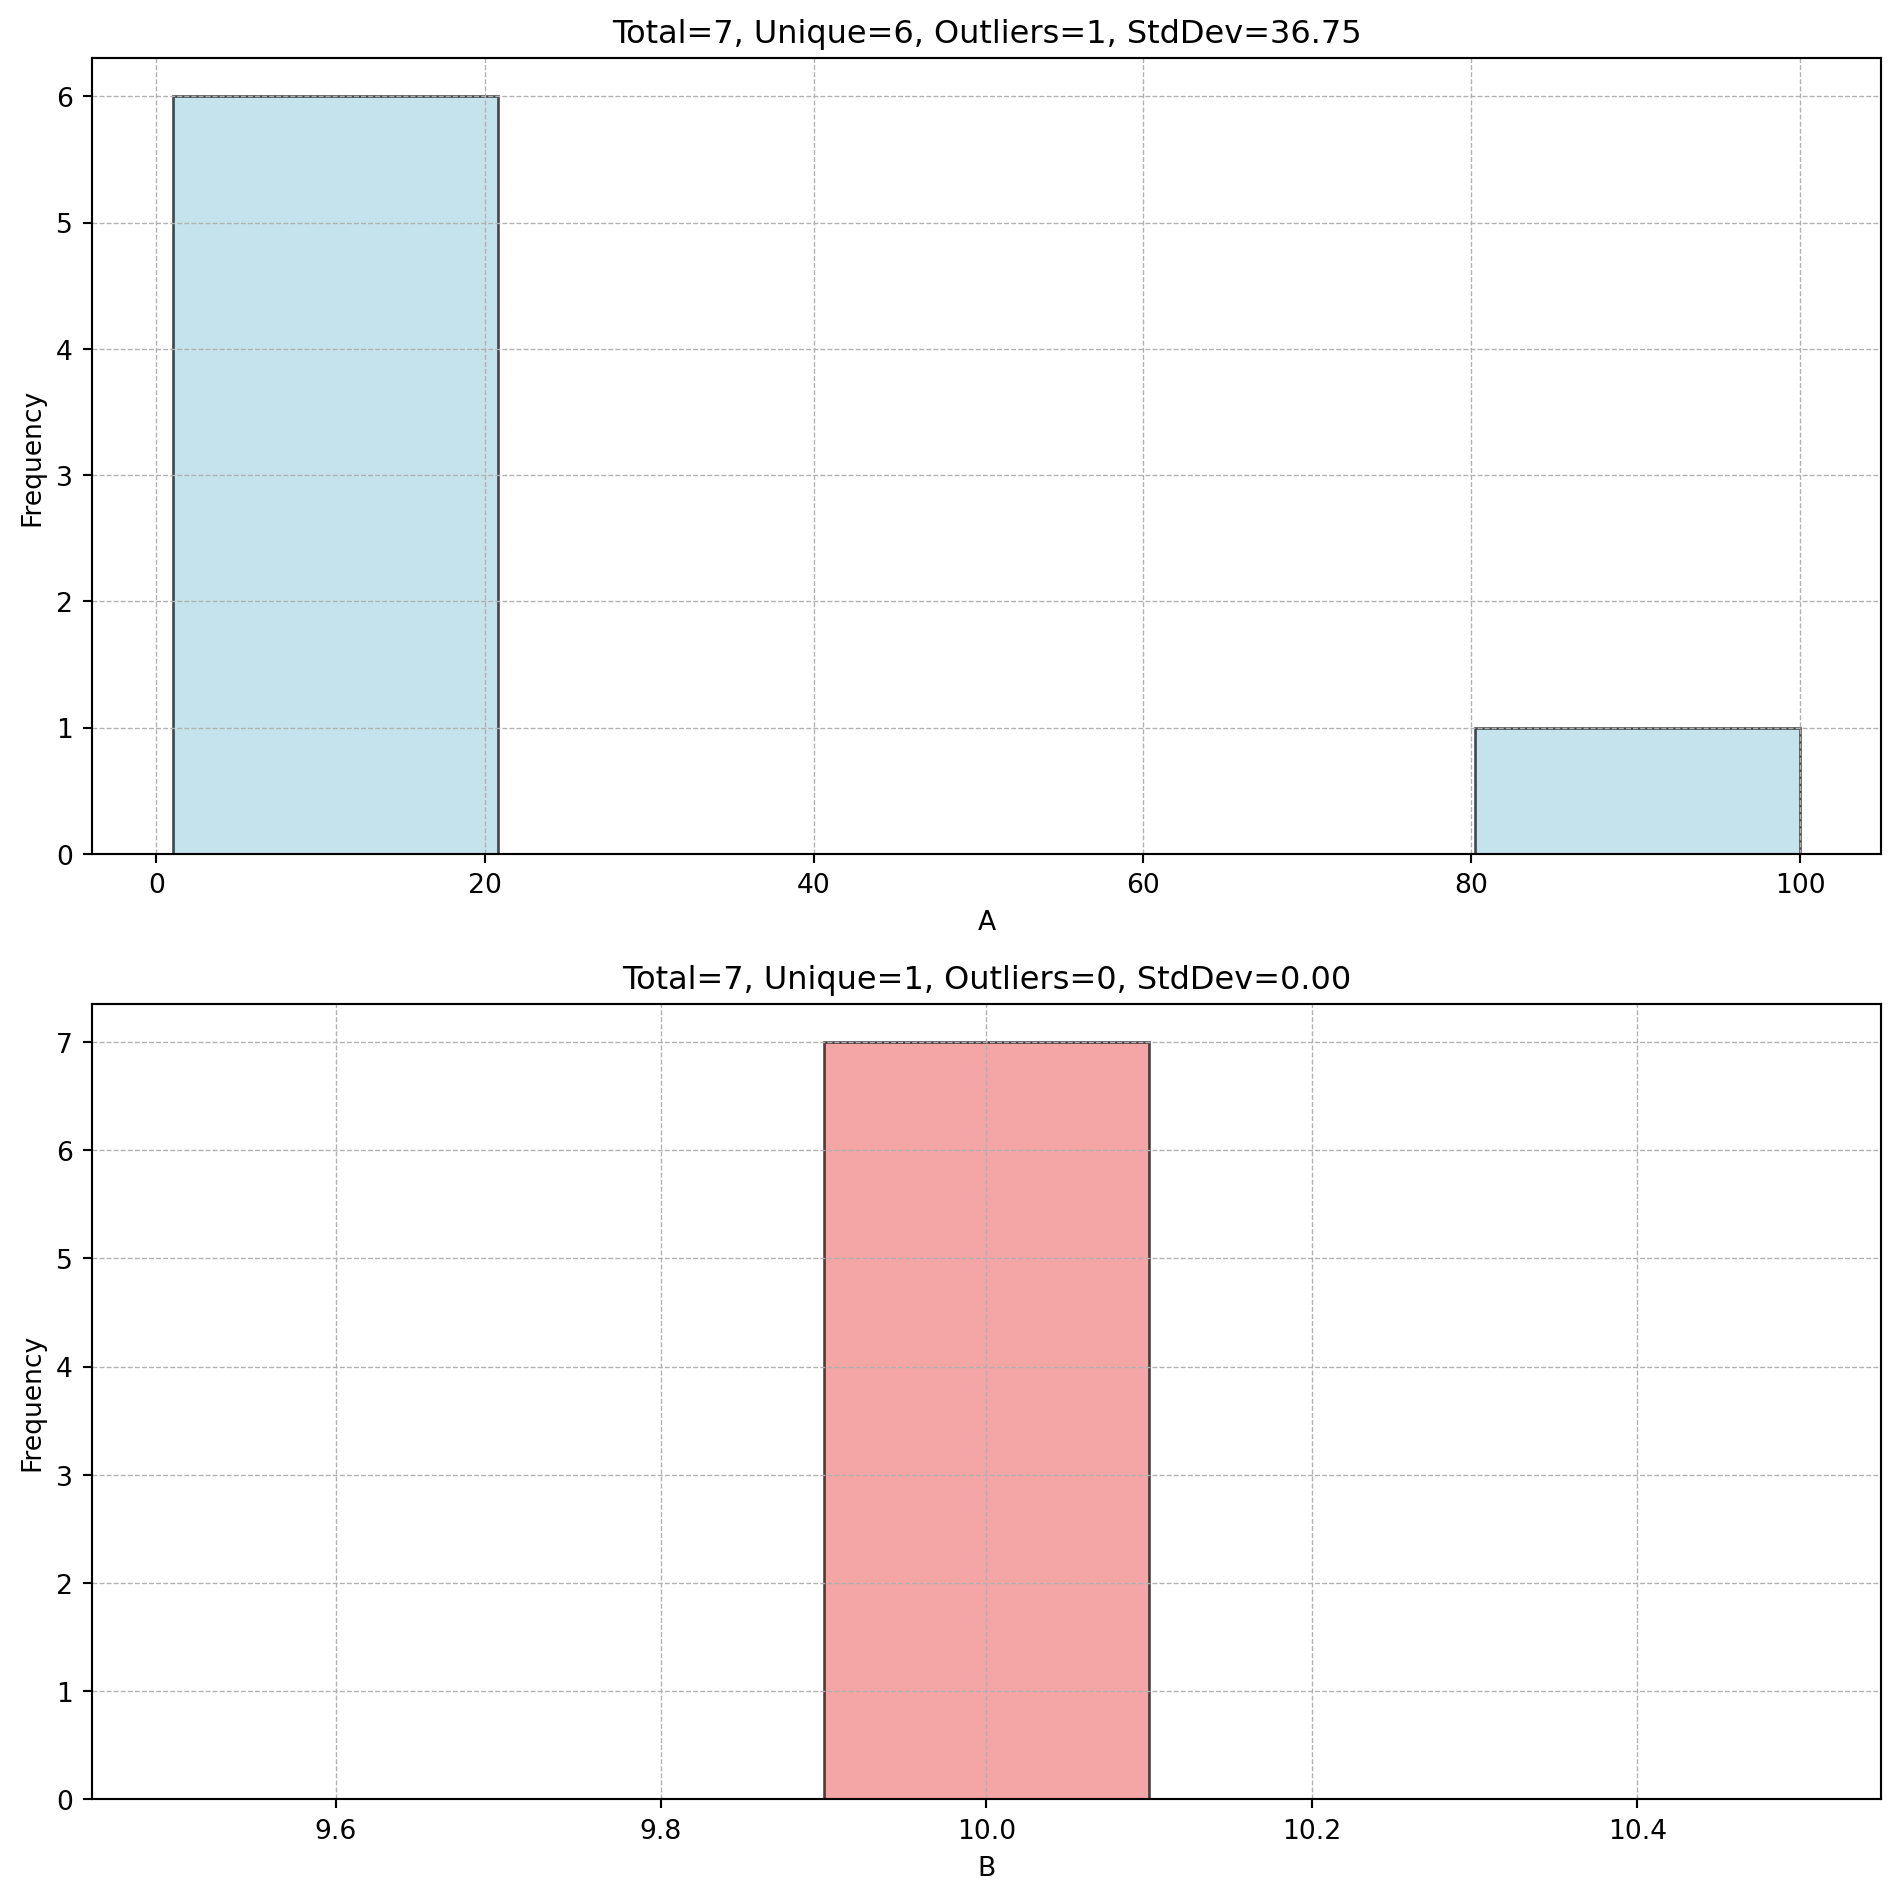
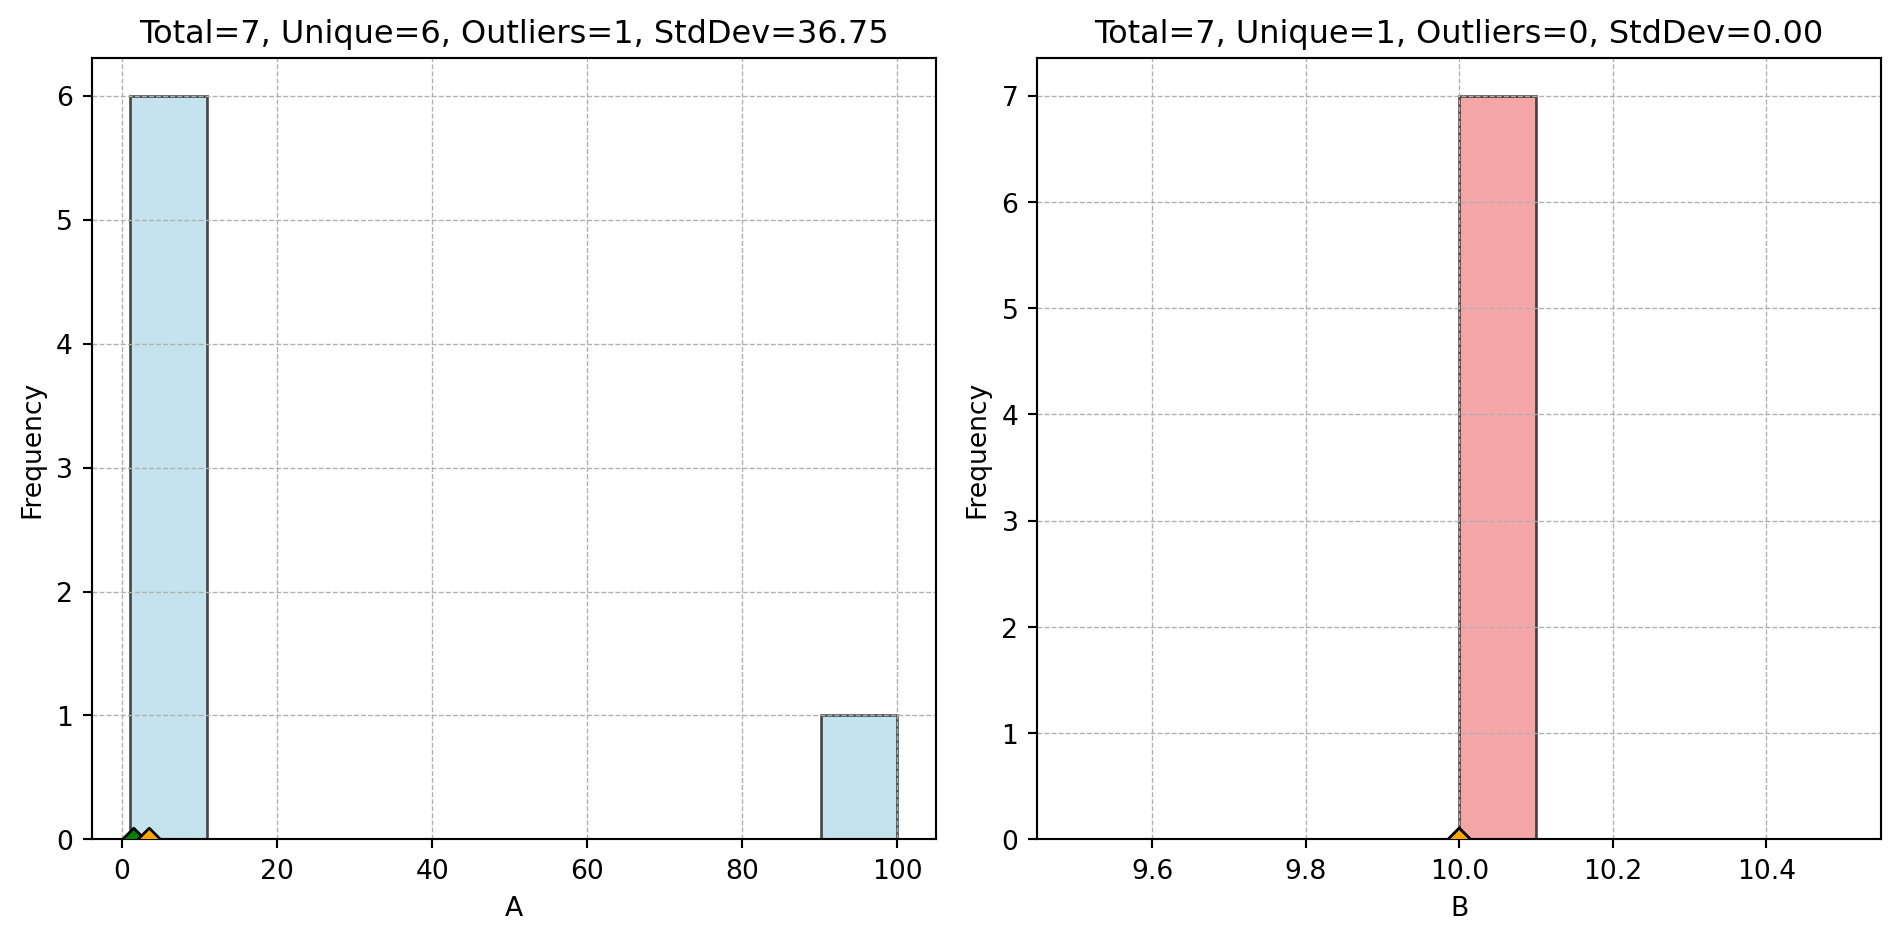
data = {'A': [1, 2, 2, 3, 4, 5, 100], 'B': [10, 10, 10, 10, 10, 10, 10]}
df = pd.DataFrame(data)
plot_ip_histograms(df, bins=5, num_cols=1, thrs_unique=3)
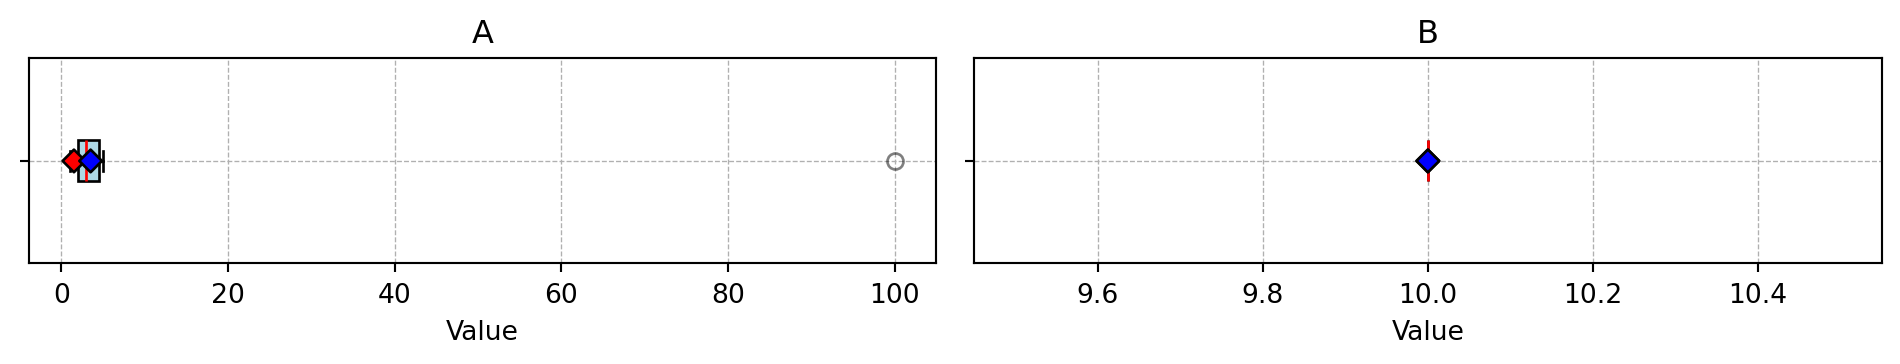
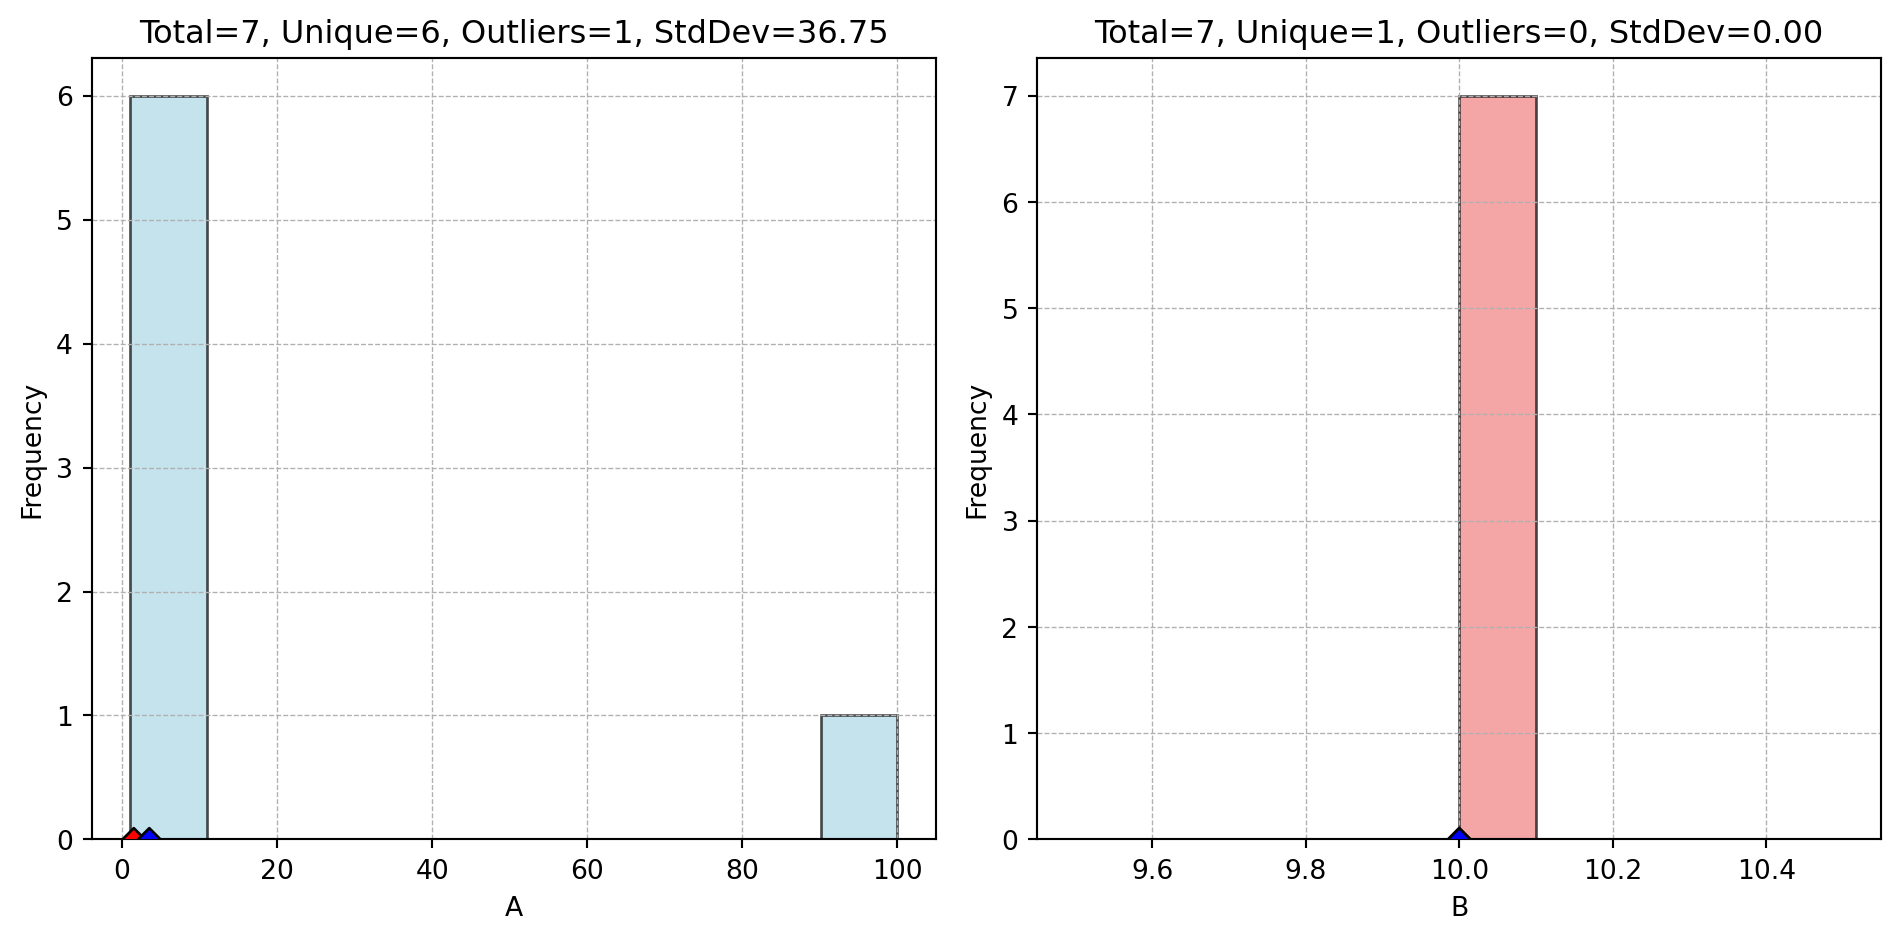
# Example with multiple added points and colors
add_points = pd.DataFrame({'A': [1.5, 3.5], 'B': [10, 10]})
plot_ip_histograms(df, add_points=add_points, add_points_col=["red", "blue"])
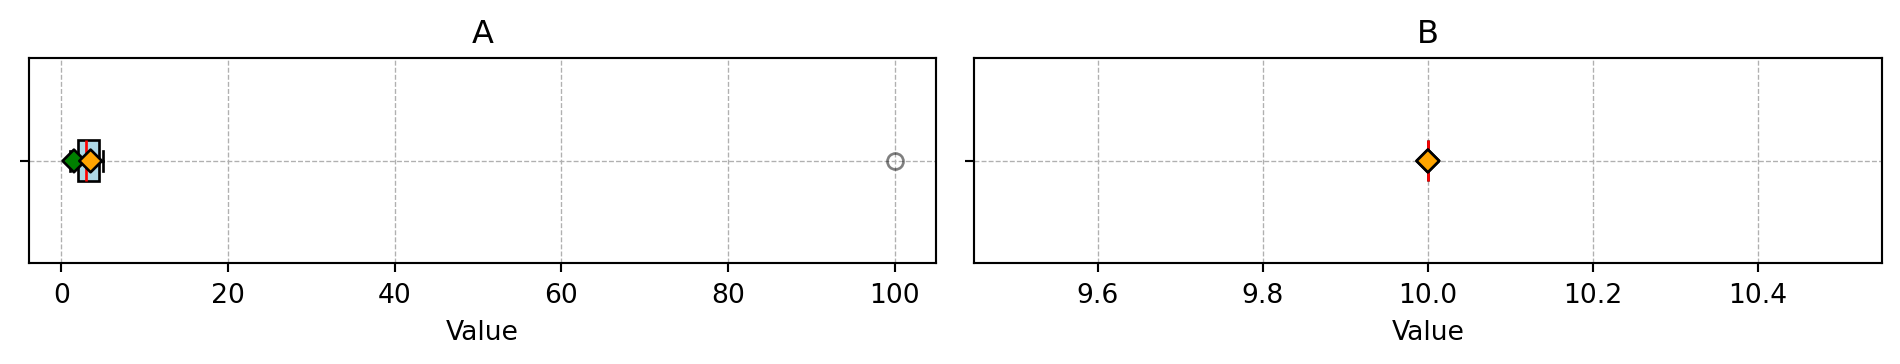
# Example: add_points with different column names are aligned automatically
add_points_renamed = pd.DataFrame({'x': [1.5, 3.5], 'y': [10, 10]})
plot_ip_histograms(df, add_points=add_points_renamed, add_points_col=["green", "orange"])