= 3 ,= True ,= 0.8 ,= 'jet' ,= 100 ,= True ,= True ,= 30 ,= (12 , 10 ),Plot surrogate contours for all combinations of the top max_imp important parameters.
This method identifies the most important parameters using importance scores, then generates surrogate contour plots for all pairwise combinations of these parameters. Factor (categorical) variables are handled by creating discrete grids and displaying factor level names on the axes.
Parameters
optimizer
SpotOptimProtocolSpotOptim instance containing optimization data.
required
max_imp
int Number of most important parameters to visualize. Defaults to 3. For max_imp=3, creates 3 plots: (0,1), (0,2), (1,2).
3
show
bool If True, displays plots immediately. Defaults to True.
True
alpha
float Transparency of 3D surface plots (0=transparent, 1=opaque). Defaults to 0.8.
0.8
cmap
str Matplotlib colormap name. Defaults to ‘jet’.
'jet'
num
int Number of grid points per dimension. Defaults to 100. For factor variables, uses the number of unique levels instead.
100
add_points
bool If True, overlay evaluated points on contour plots. Defaults to True.
True
grid_visible
bool If True, show grid lines. Defaults to True.
True
contour_levels
int Number of contour levels. Defaults to 30.
30
figsize
tuple of int
Figure size in inches (width, height). Defaults to (12, 10).
(12, 10)
Raises
ValueError If optimization hasn’t been run yet or max_imp is invalid.
Examples
import numpy as npfrom spotoptim import SpotOptimfrom spotoptim.plot.visualization import plot_important_hyperparameter_contourfrom spotoptim.function import sphere# Initialize and run optimizer with enough dimensions (here 4) = SpotOptim(fun= sphere, bounds= [(- 5 , 5 )]* 4 ,= 10 , n_initial= 5 ,= ['temp' , 'pressure' , 'velocity' , 'acceleration' ])= opt.optimize()# Plot contours for top 3 important hyperparameters = 3 , show= False )
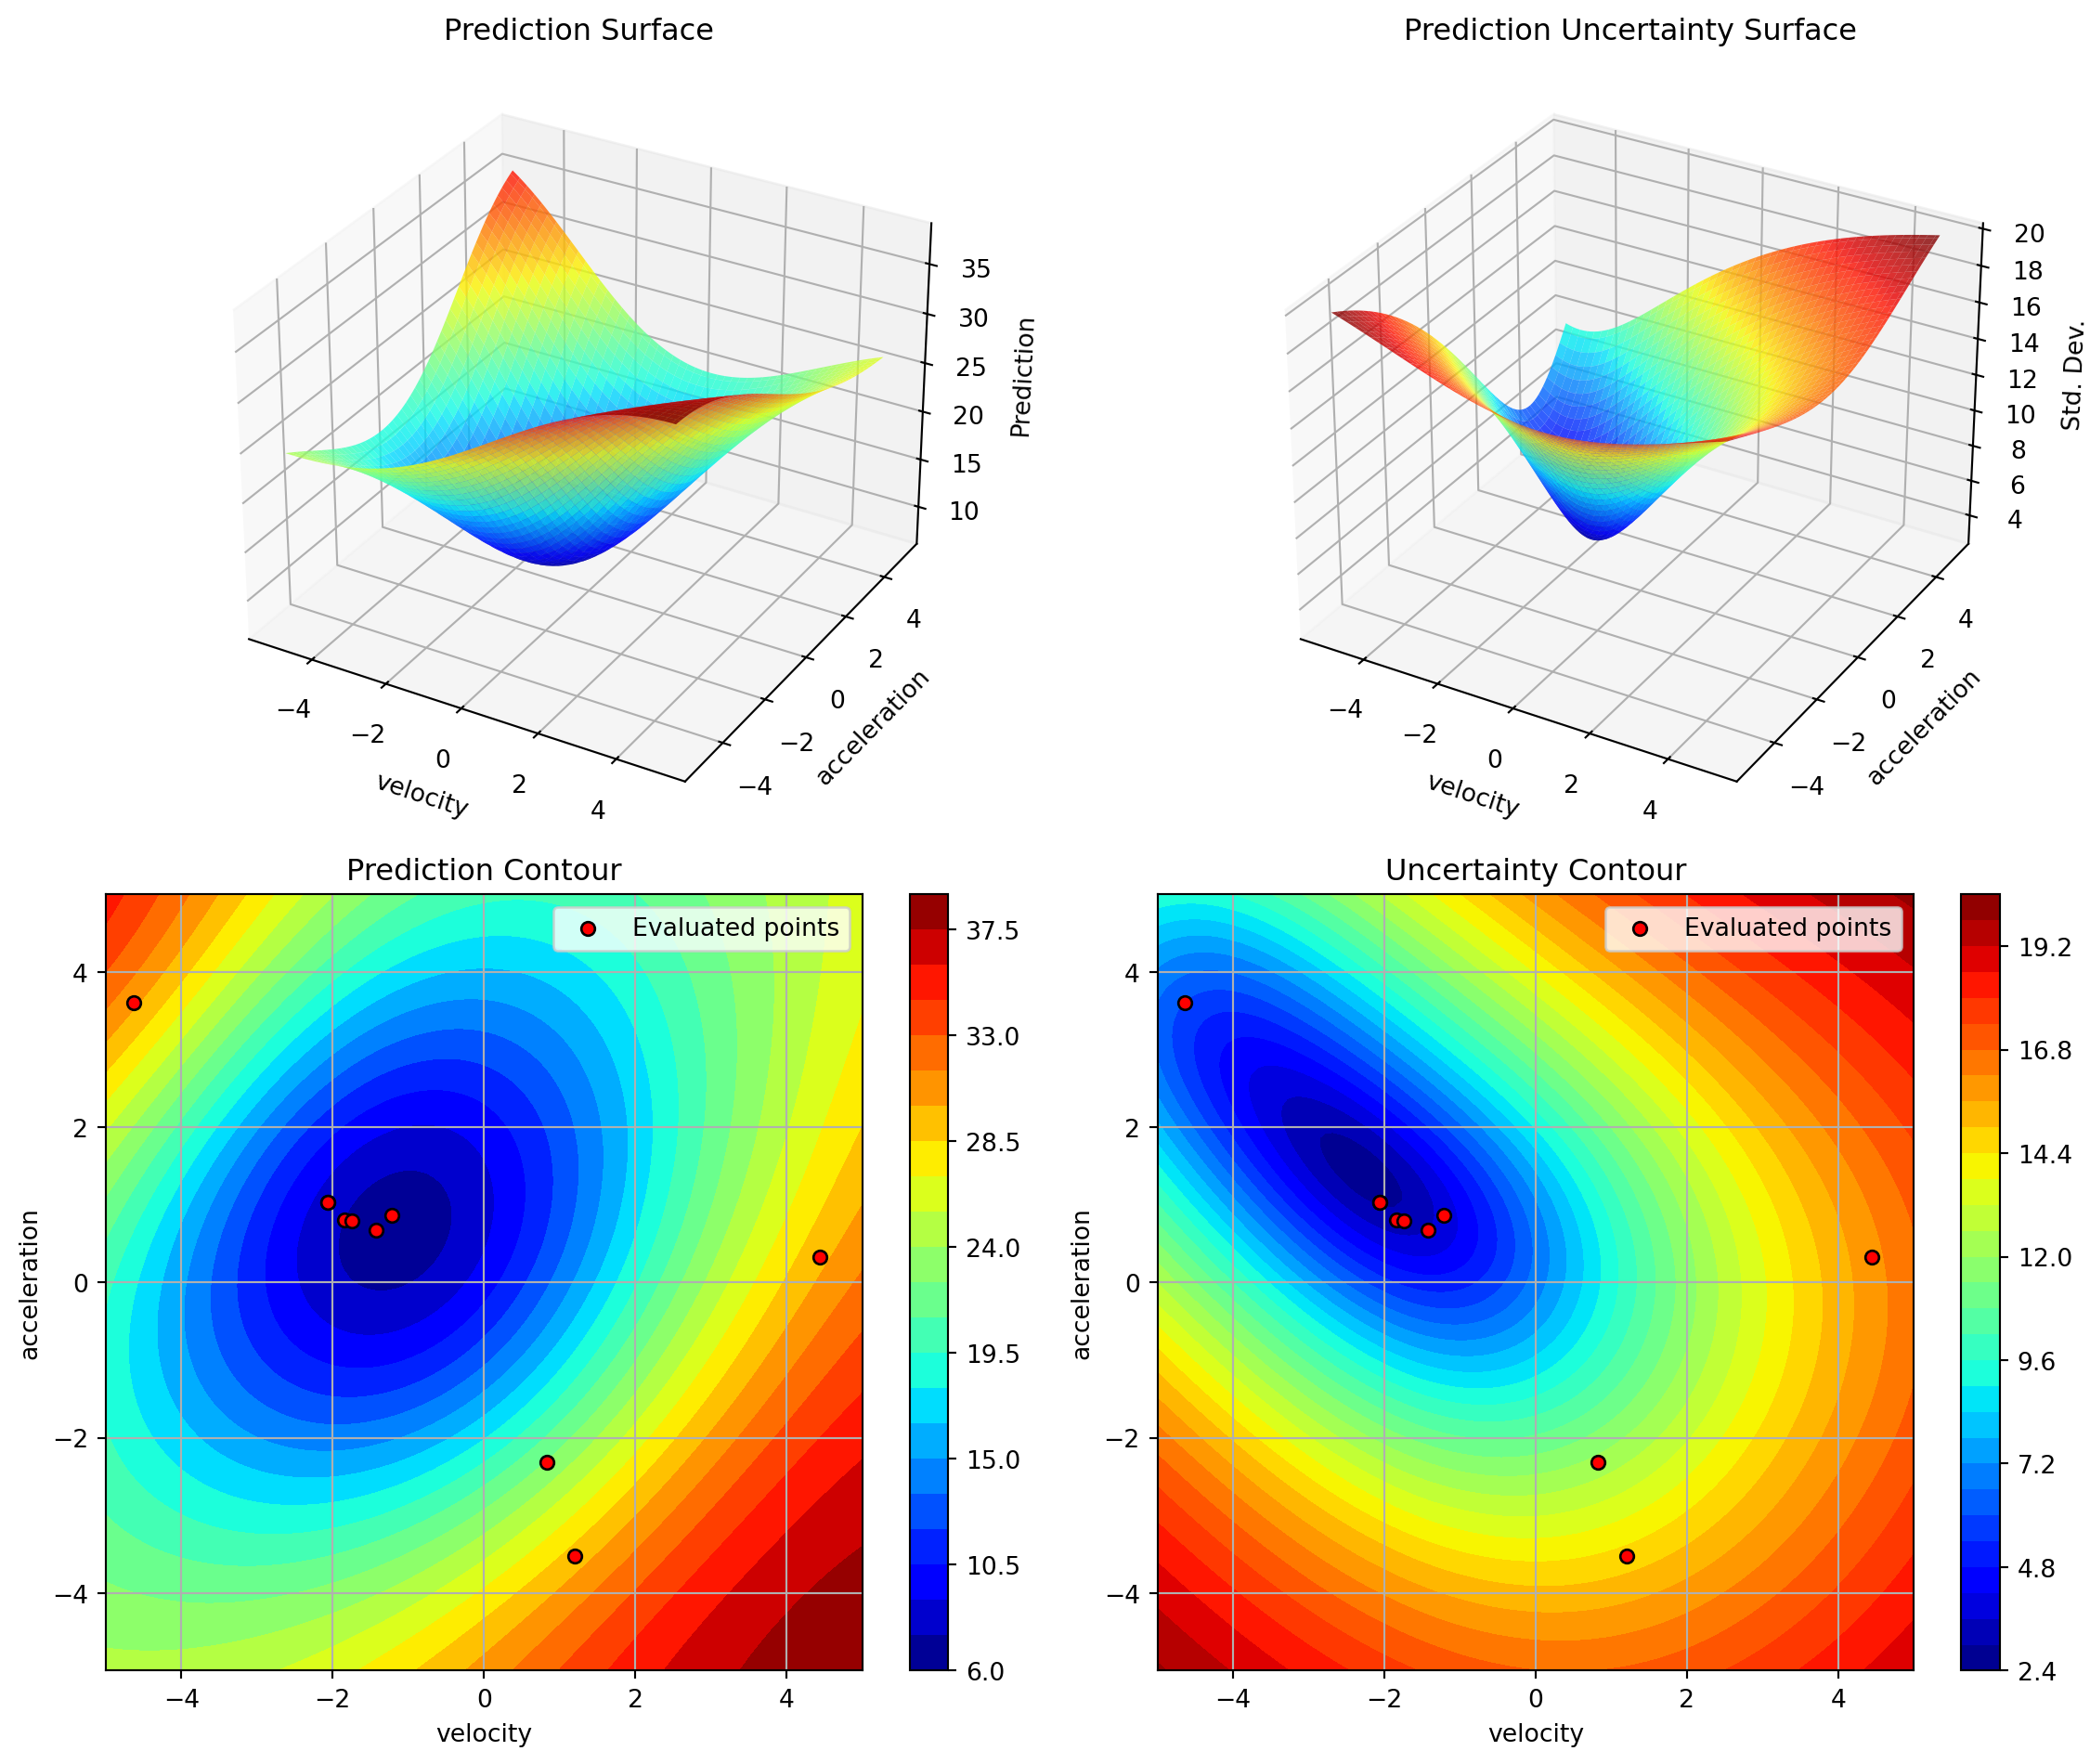
Plotting surrogate contours for top 3 most important parameters:
velocity: importance = 33.59% (type: float)
acceleration: importance = 31.25% (type: float)
pressure: importance = 21.46% (type: float)
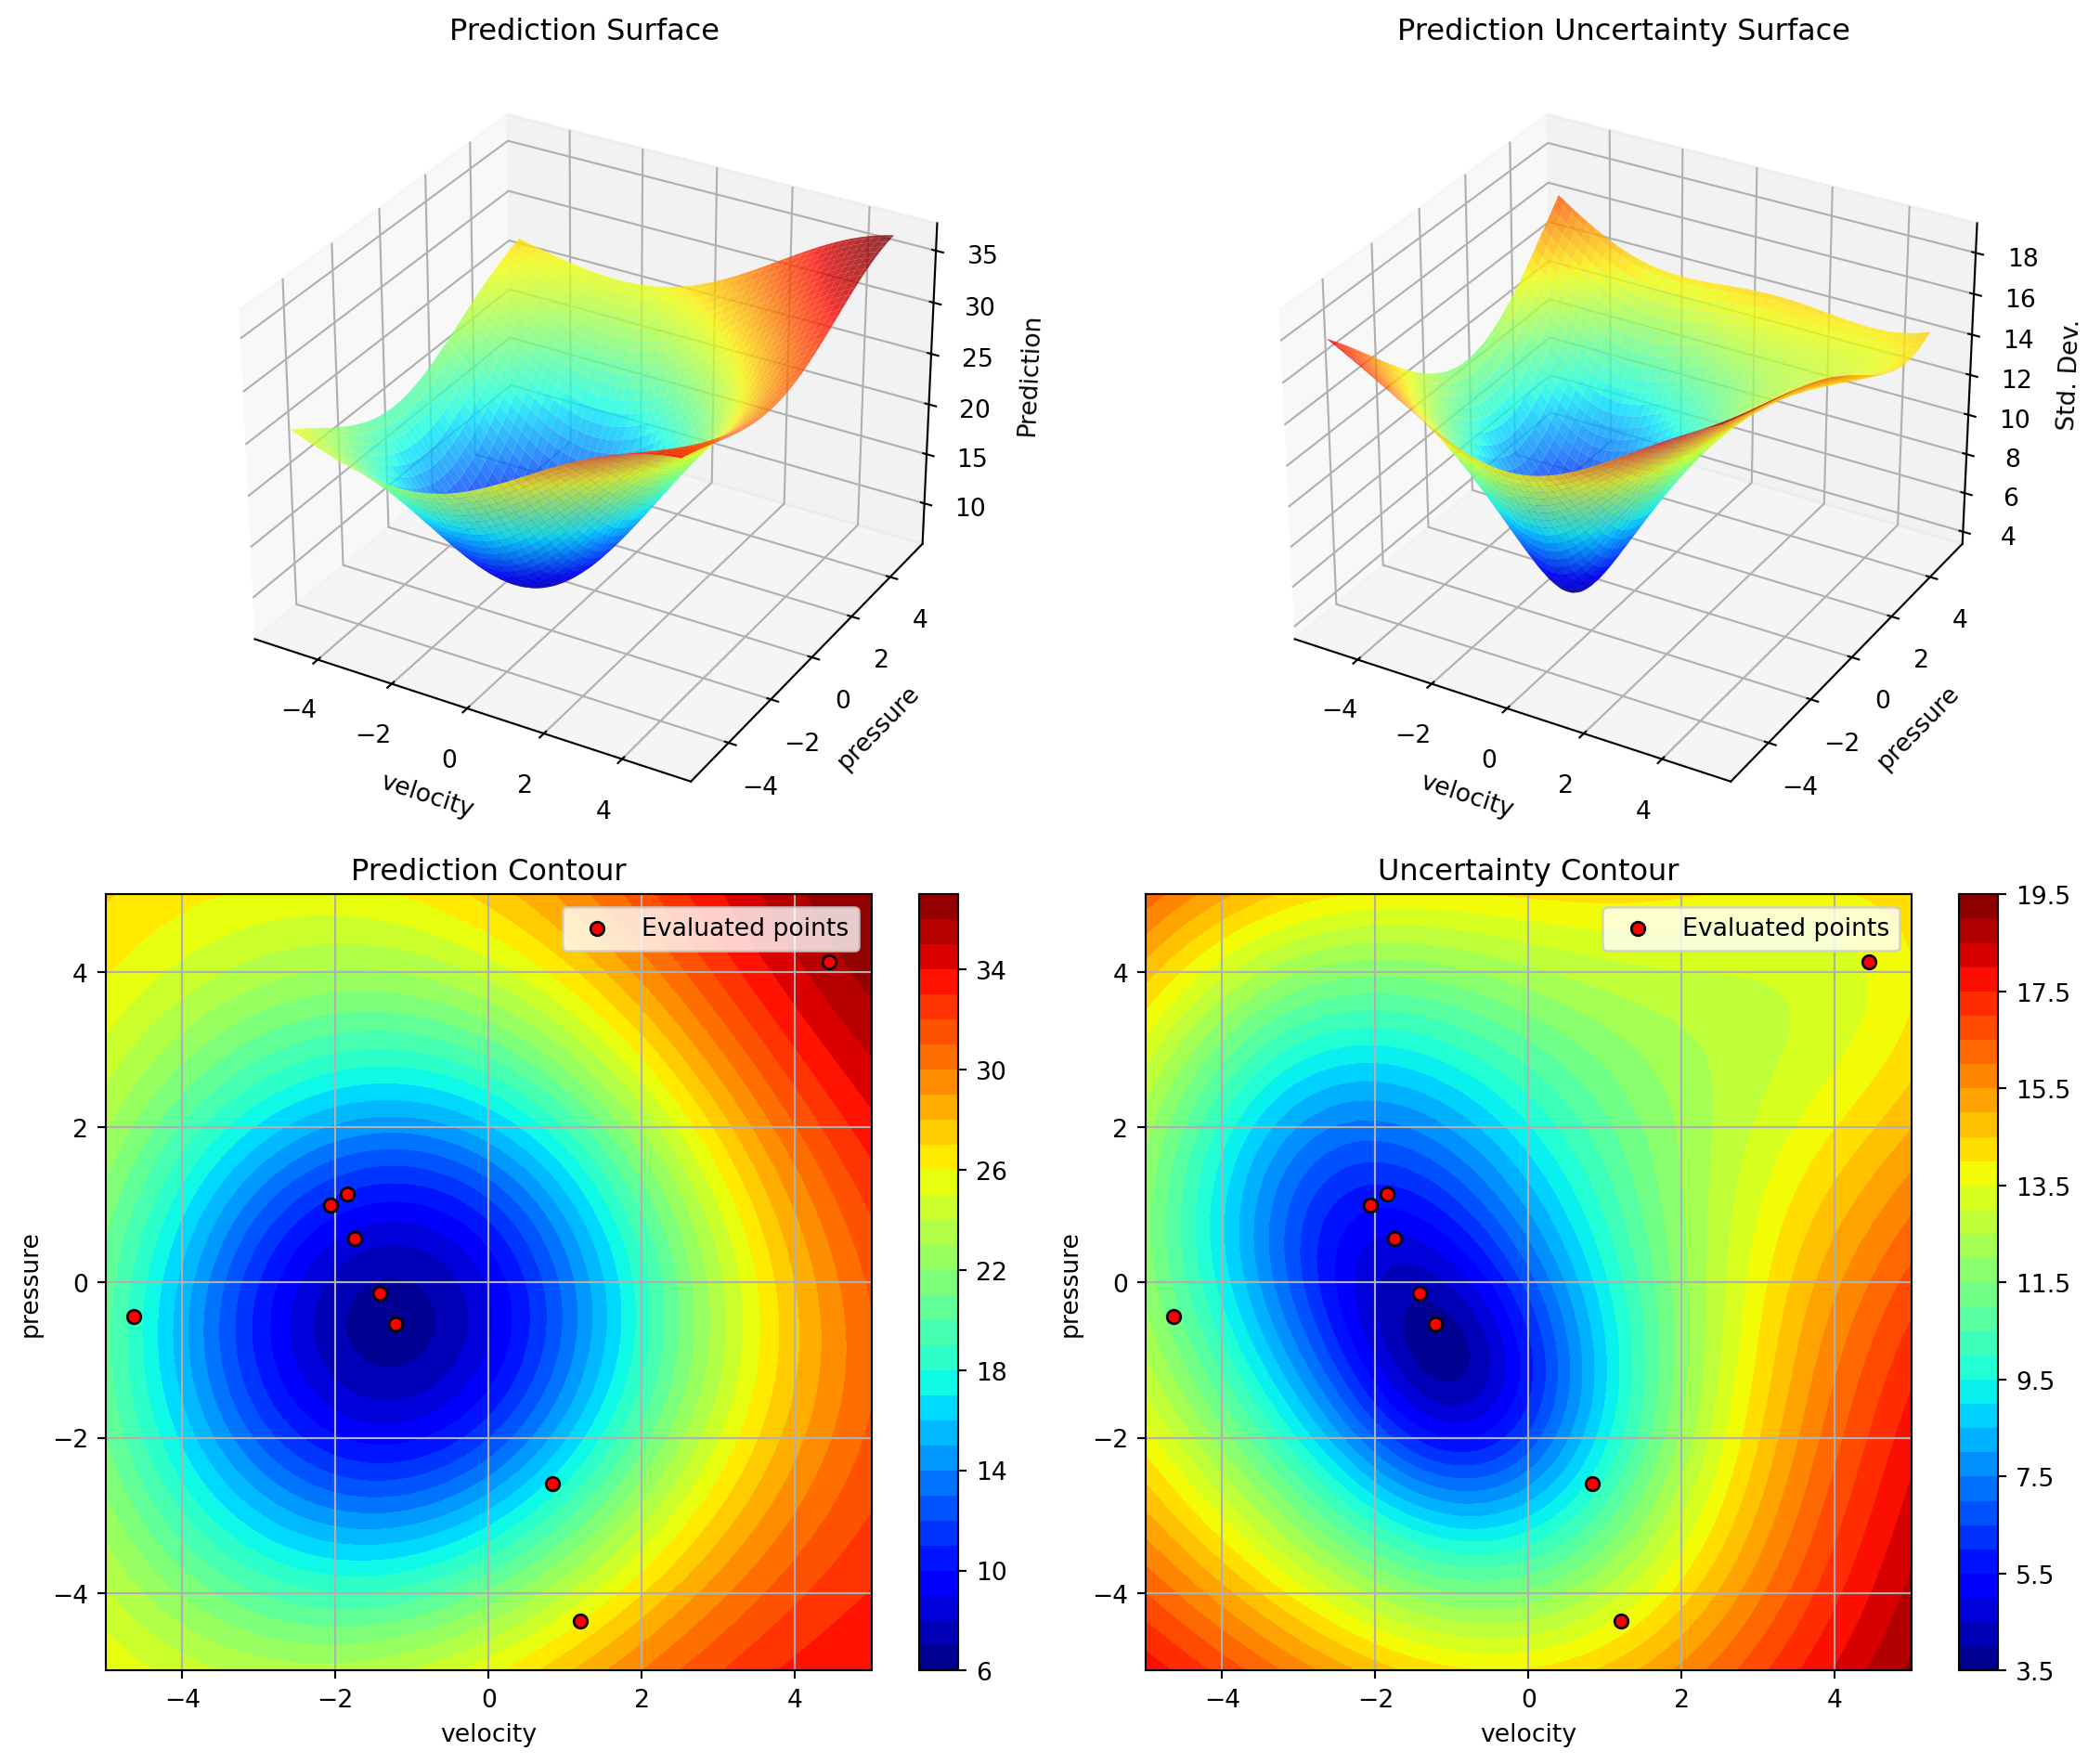
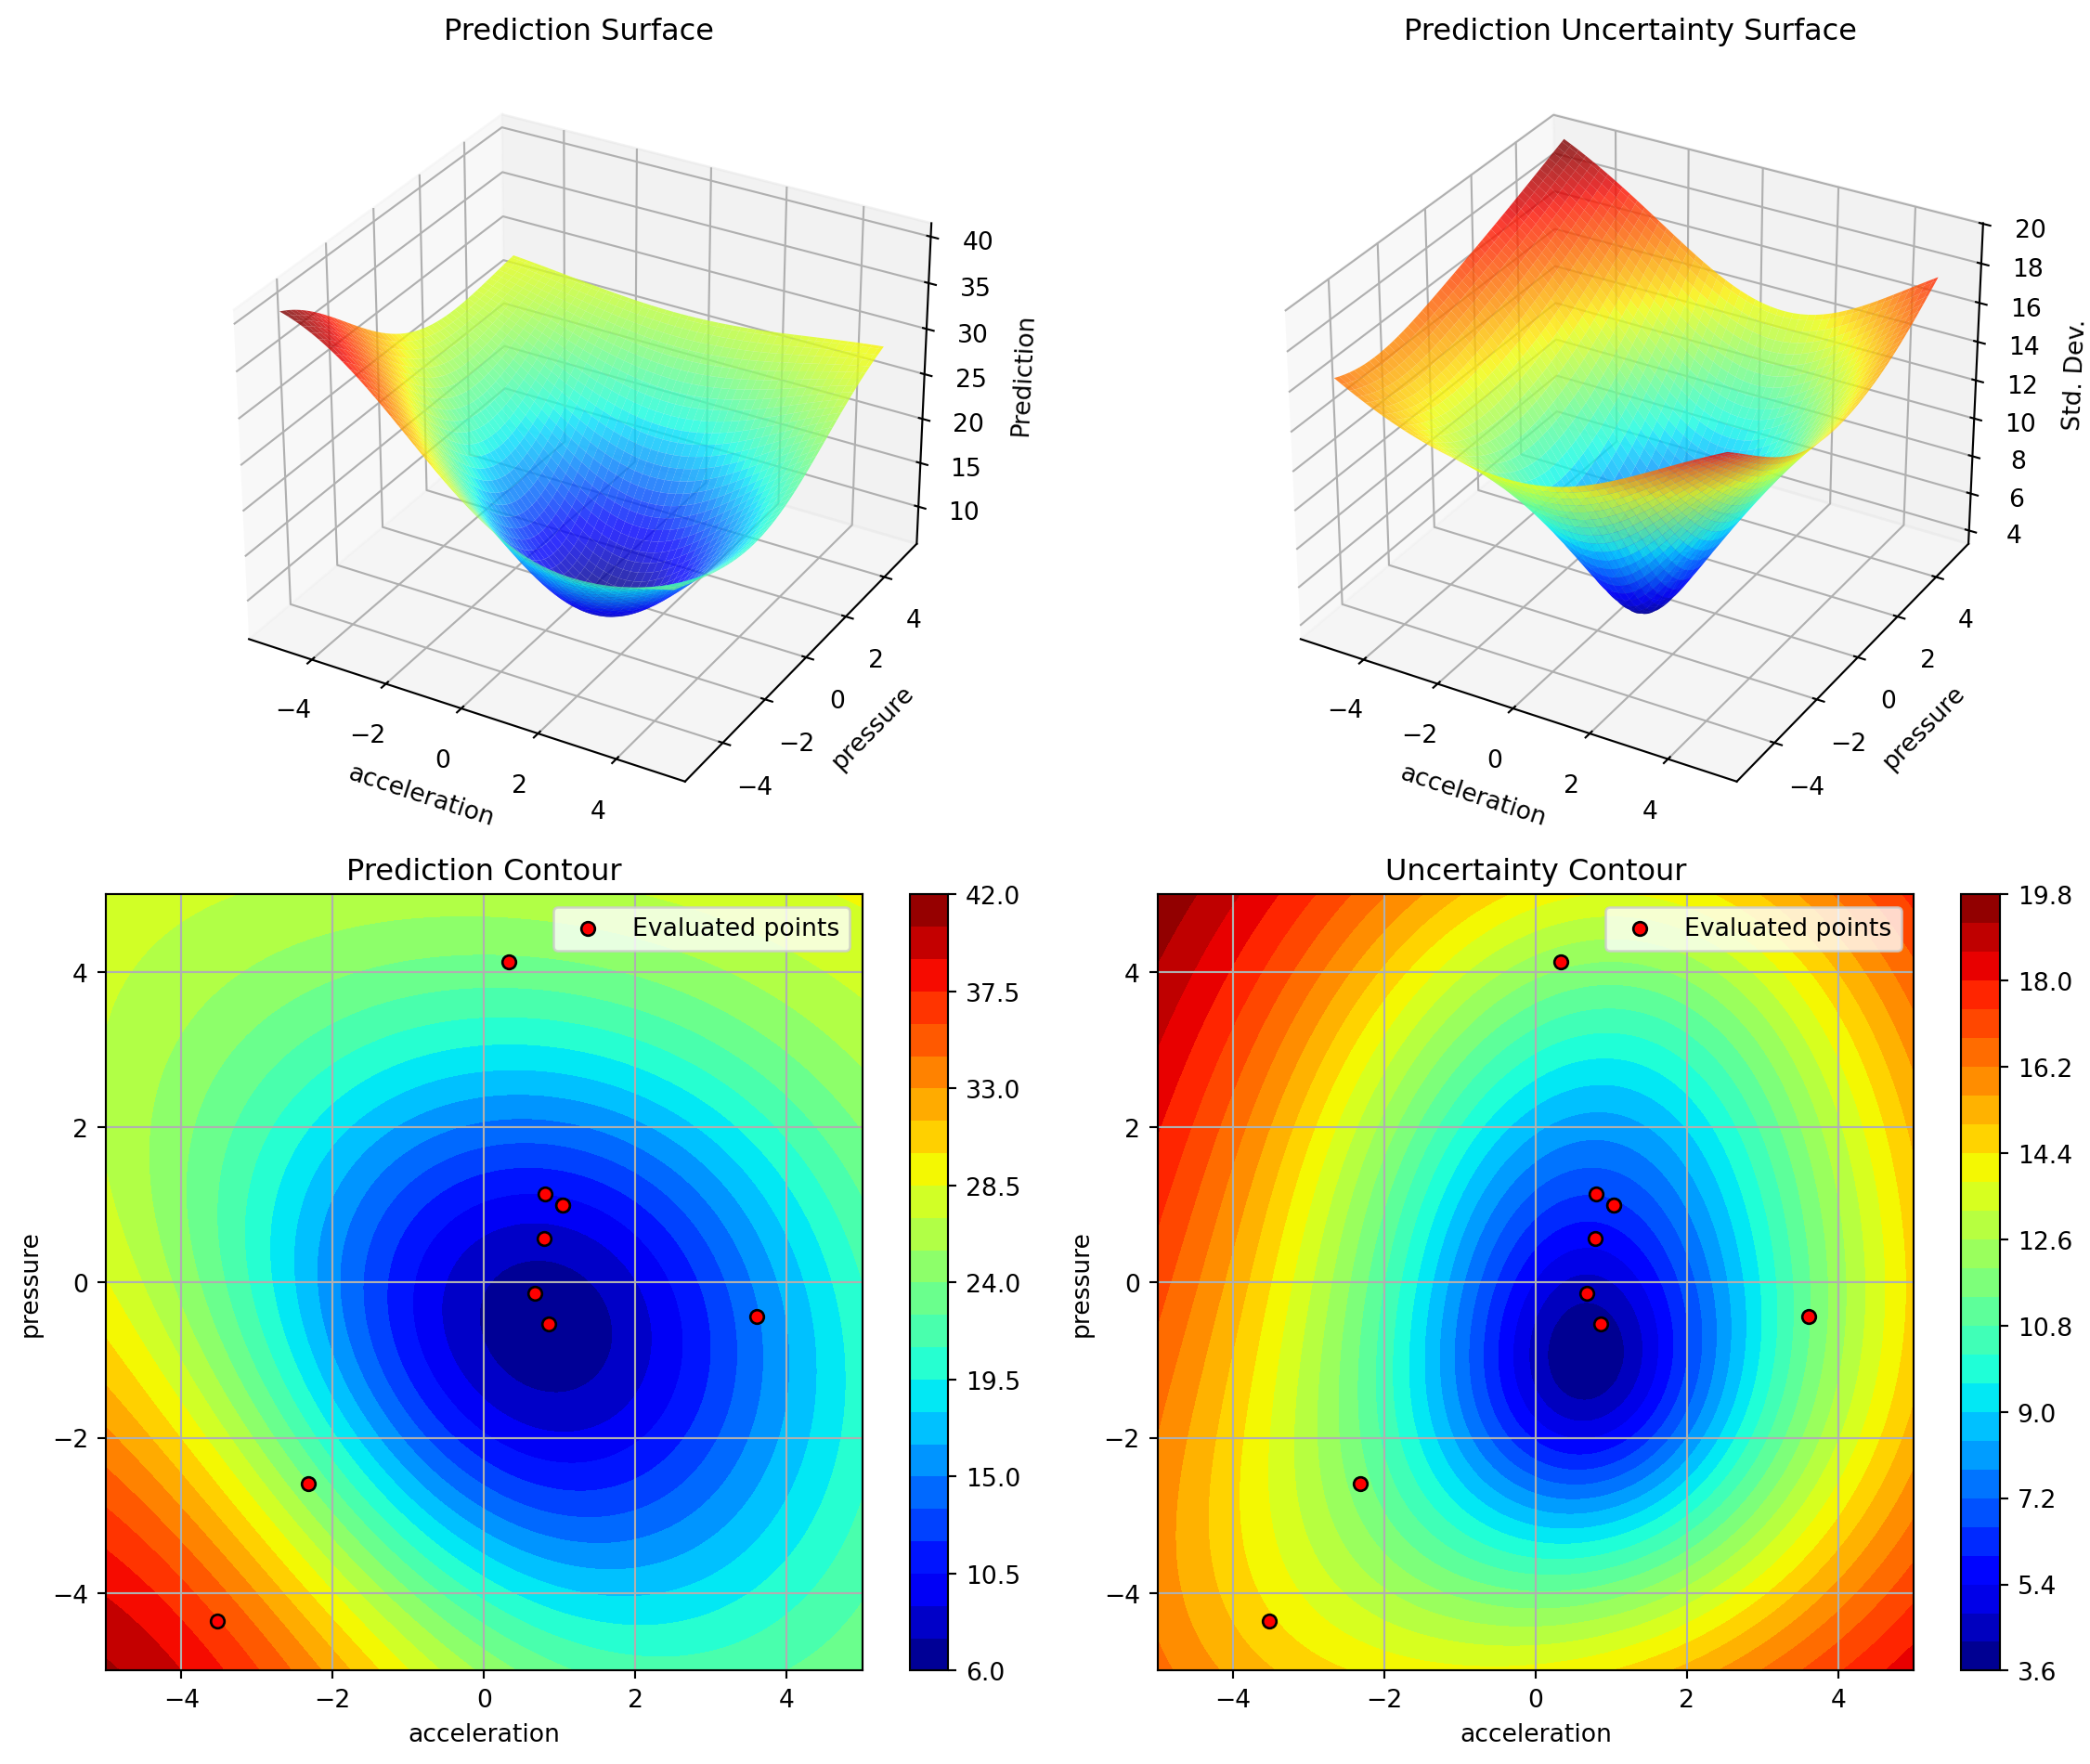
Generating 3 surrogate plots...
Plotting velocity vs acceleration
Plotting velocity vs pressure
Plotting acceleration vs pressure