Simple SpotOptim run
The following example demonstrates how to use SpotOptim with the Sphere function.
import numpy as np
from spotoptim import SpotOptim

def sphere(X):
    X = np.atleast_2d(X)
    return np.sum(X**2, axis=1)

opt = SpotOptim(
    fun=sphere,
    bounds=[(-5, 5), (-5, 5)],
    max_iter=20,
    n_initial=10,
    seed=0,
)
result = opt.optimize()

print(f"Best x    : {result.x}")
print(f"Best f(x) : {result.fun:.6f}")
print(f"Evaluations: {result.nfev}")
Best x    : [-0.00016718  0.00071419]
Best f(x) : 0.000001
Evaluations: 20
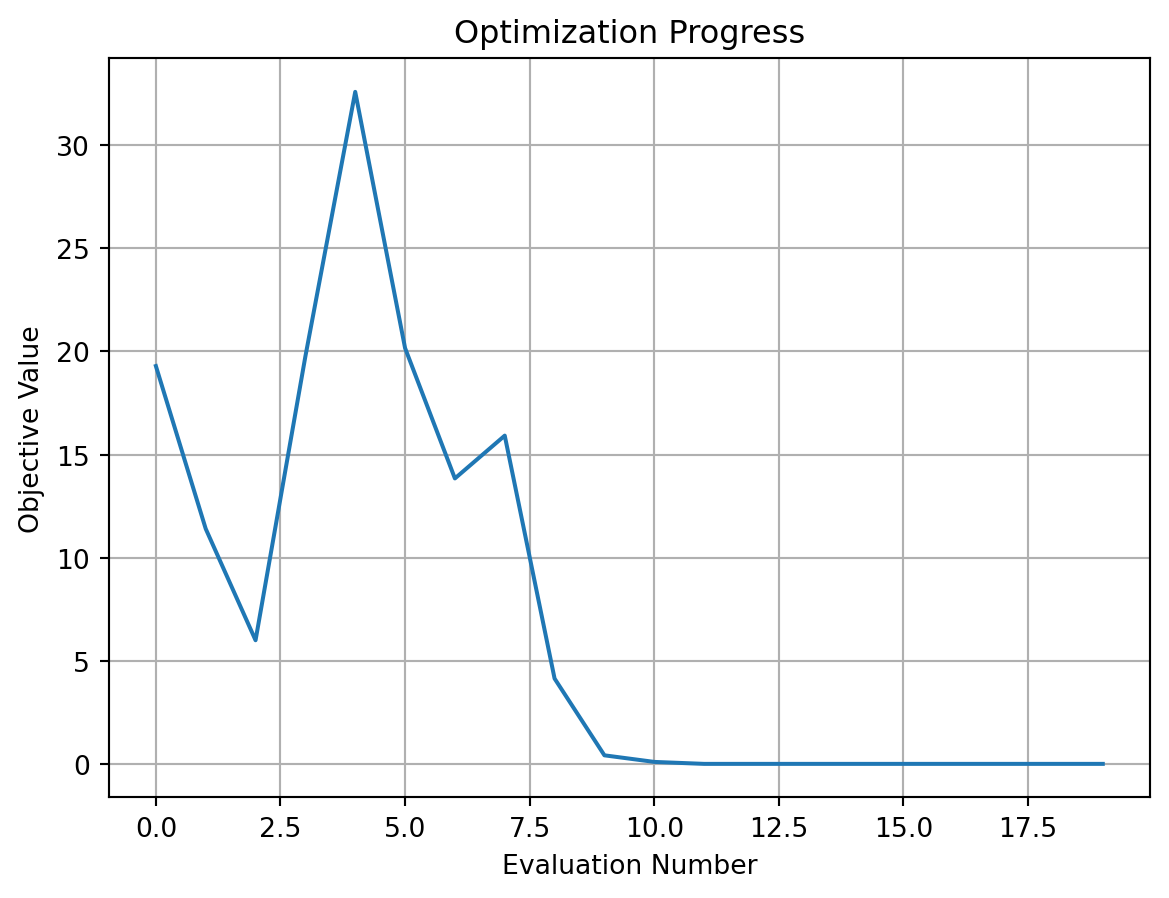
Convergence Plot
import matplotlib.pyplot as plt
plt.plot(result.y)
plt.xlabel("Evaluation Number")
plt.ylabel("Objective Value")
plt.title("Optimization Progress")
plt.grid(True)
plt.show()
Further Examples
More detailed examples showing acquisition functions, integer variables, and categorical variables can be found in the Living Examples document.