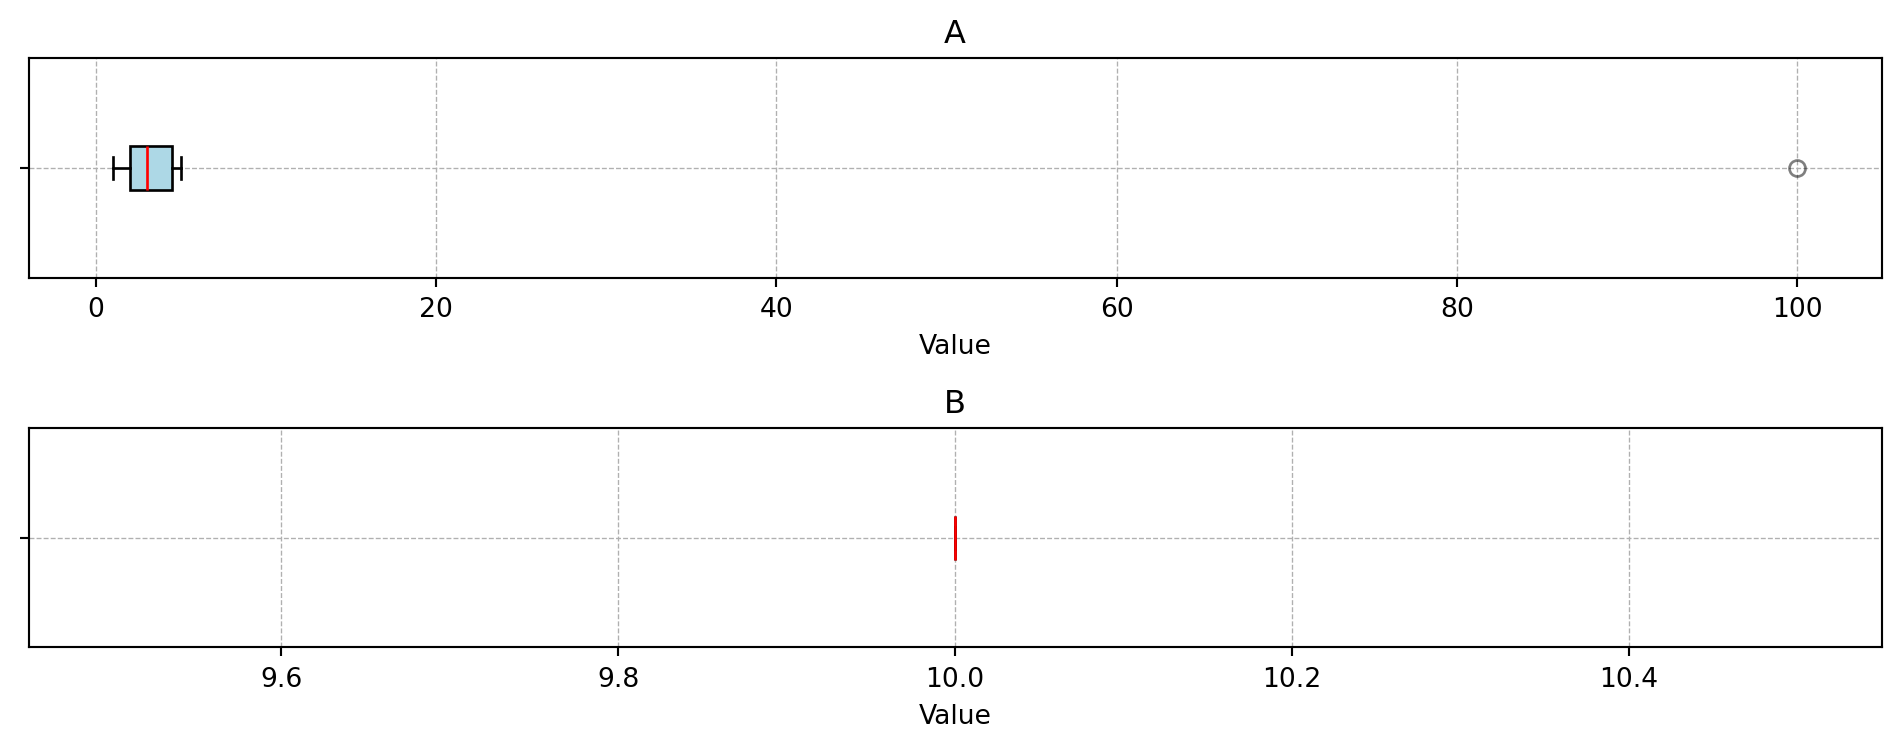
Generate infill-point boxplots for each numerical column in a DataFrame.
A separate horizontal boxplot is created for each numerical column of df and arranged in a grid. Each subplot uses its own axis scale, mirroring the behaviour of plot_ip_histograms. An optional categorical grouping column splits the data into one box per category level.
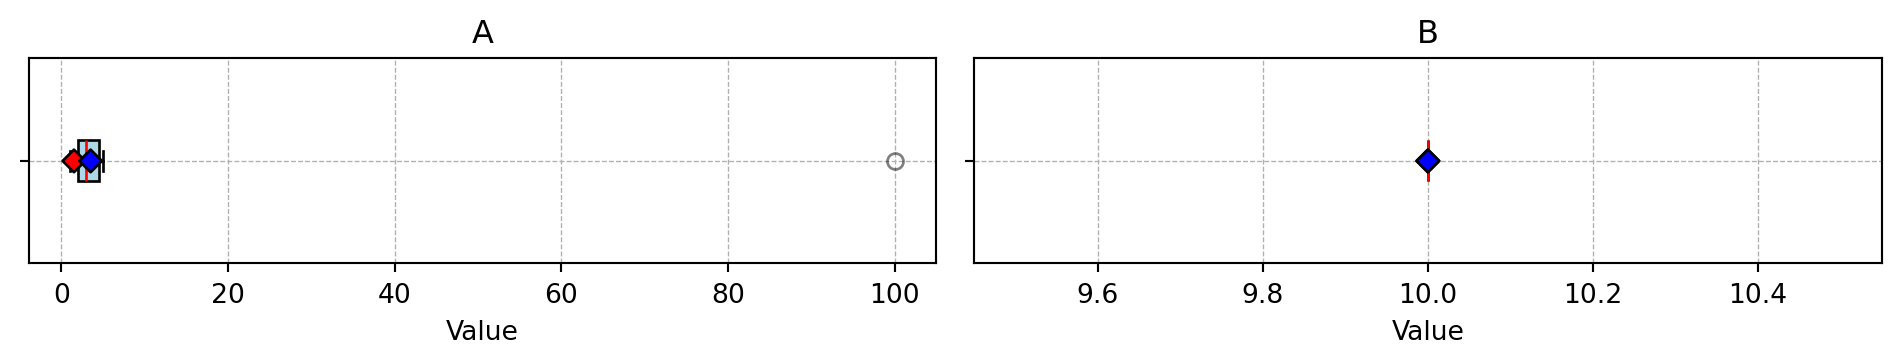
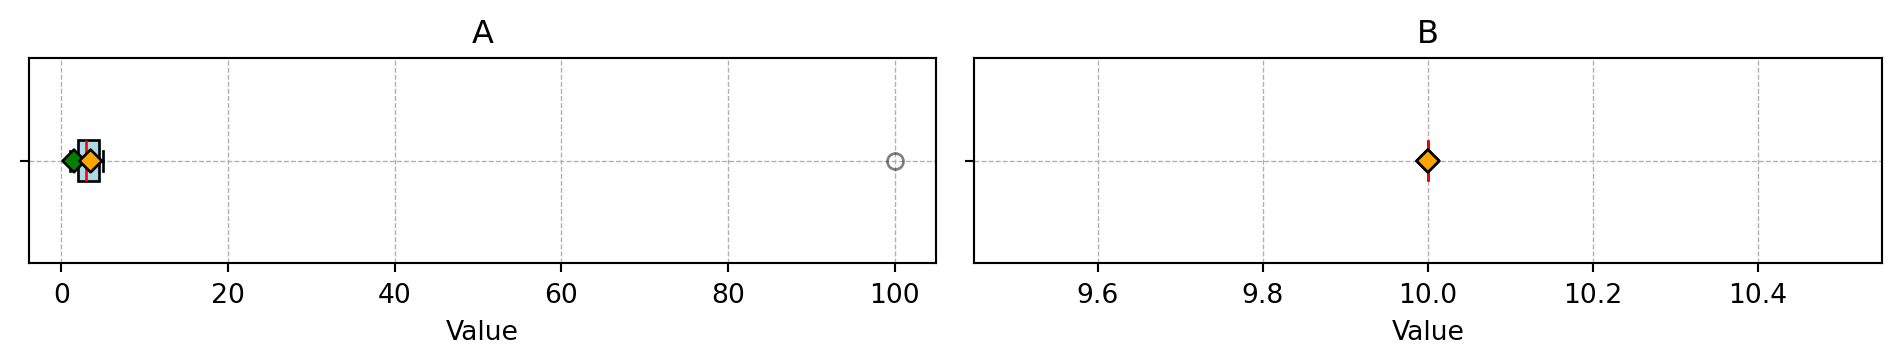
If add_points is provided and its numerical columns differ from those of df in name but agree in count, the column names of add_points are silently replaced by those of df before plotting. This ensures that infill points drawn from a differently named search space are always overlaid correctly.
When True, the subplot title shows both the variable name and, if applicable, the category column name. When False, only the variable name is shown. Defaults to True.
If the number of rows in add_points does not equal the length of add_points_col.
Examples
import pandas as pdfrom spotoptim.eda.plots import plot_ip_boxplotsdata = {'A': [1, 2, 2, 3, 4, 5, 100], 'B': [10, 10, 10, 10, 10, 10, 10]}df = pd.DataFrame(data)plot_ip_boxplots(df, num_cols=1)# Example with multiple added points and colorsadd_points = pd.DataFrame({'A': [1.5, 3.5], 'B': [10, 10]})plot_ip_boxplots(df, add_points=add_points, add_points_col=["red", "blue"])# Example: add_points with different column names are aligned automaticallyadd_points_renamed = pd.DataFrame({'x': [1.5, 3.5], 'y': [10, 10]})plot_ip_boxplots(df, add_points=add_points_renamed, add_points_col=["green", "orange"])
References
Bartz-Beielstein, T. (2025). Multi-Objective Optimization and Hyperparameter Tuning With Desirability Functions. arXiv preprint arXiv:2503.23595. https://arxiv.org/abs/2503.23595