Implements a desirability function for target optimization.
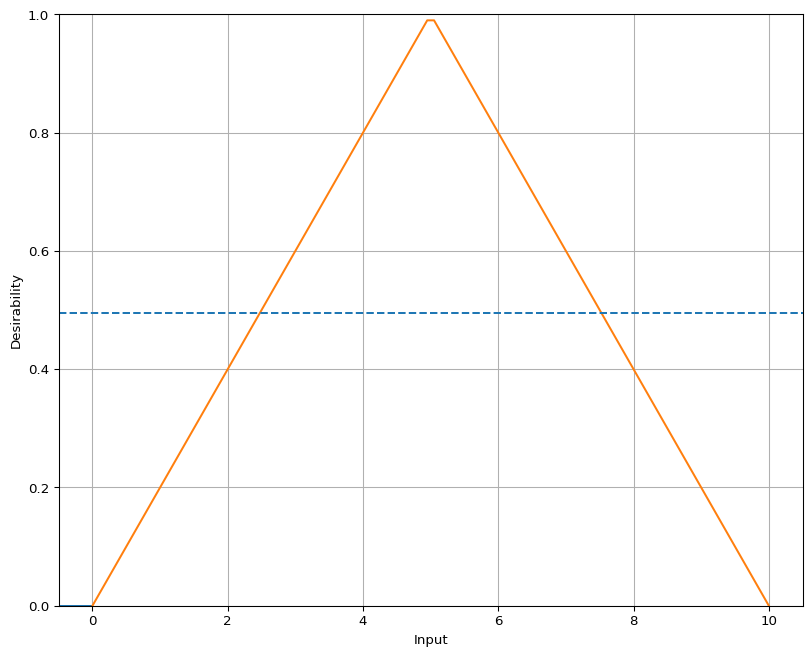
The desirability function assigns a value of 0 for inputs outside the range [low, high], scales the desirability between 0 and 1 for inputs within [low, target] using low_scale, and scales the desirability between 1 and 0 for inputs within [target, high] using high_scale.
The value to use for missing inputs. Defaults to a non-informative value.
Functions
Predicts the desirability values for the given input data.
Plots the desirability function.
References
Many thanks to Max Kuhn for his implementation of the ‘desirability’ package in R. This class is based on the ‘desirability’ package in R, see: https://cran.r-project.org/package=desirability
Examples
from spotdesirability import DTargetimport numpy as npimport matplotlib.pyplot as plt# Create a DTarget objectdtarget = DTarget(low=0, target=5, high=10, low_scale=1, high_scale=1)# Predict desirability for a range of inputsinputs = np.array([-5, 0, 2.5, 5, 7.5, 10, 15])desirability = dtarget.predict(inputs)print(desirability)# [0. 0. 0.5 1. 0.5 0. 0. ]# Plot the desirability functiondtarget.plot()
[ 0. 0. 0.5 1. 0.5 -0. 0. ]
Methods
Name
Description
predict
Predicts the desirability values for the given input data.