The value to use for missing inputs. Defaults to a non-informative value.
Functions
Predicts the desirability values for the given input data.
Plots the desirability function.
References
Many thanks to Max Kuhn for his implementation of the ‘desirability’ package in R. This class is based on the ‘desirability’ package in R, see: https://cran.r-project.org/package=desirability
Examples
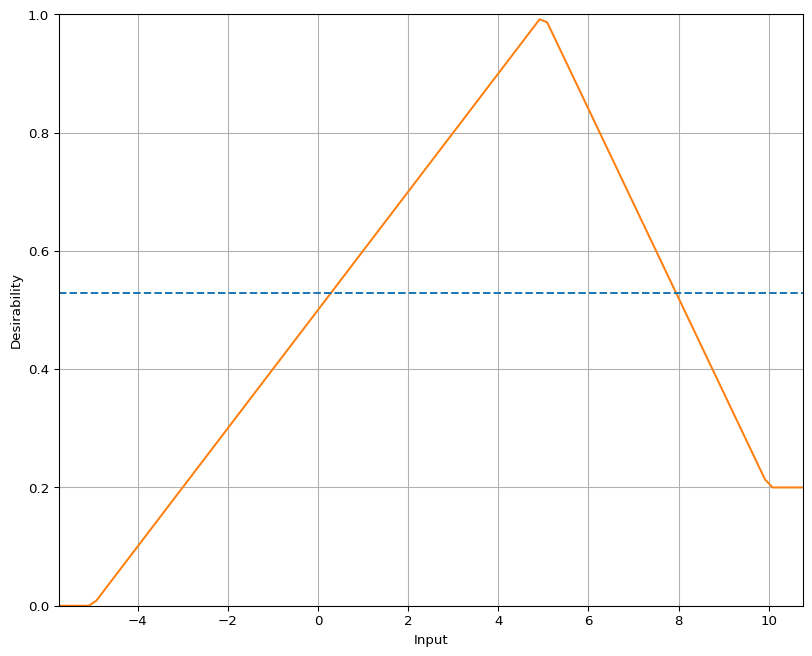
from spotdesirability import DArbimport numpy as npimport matplotlib.pyplot as plt# Define input and desirability valuesx = [-5, 0, 5, 10]d = [0, 0.5, 1, 0.2]# Create a DArb objectdarb = DArb(x, d)# Predict desirability for a range of inputsinputs = np.array([-10, -5, 0, 5, 10, 15])desirability = darb.predict(inputs)print(desirability)# [0. 0. 0.5 1. 0.2 0.2]# Plot the desirability functiondarb.plot()
[0. 0. 0.5 1. 0.2 0.2]
Methods
Name
Description
plot
Plots the arbitrary desirability function.
predict
Predicts the desirability values for the given input data.